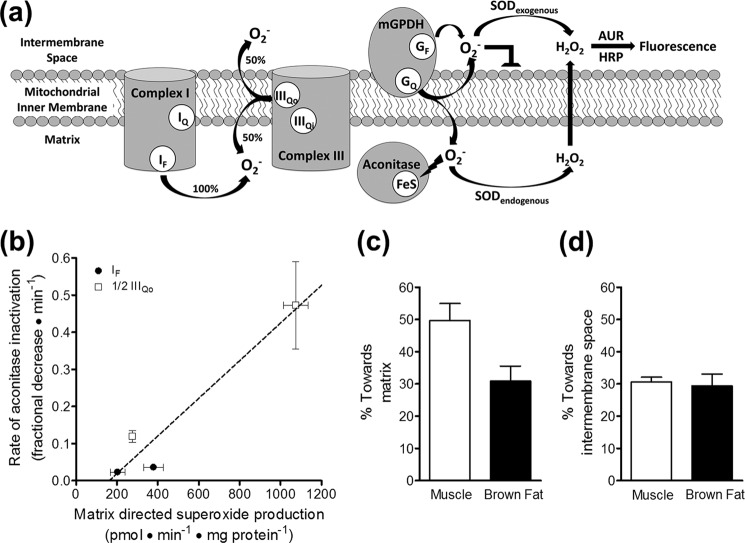
FIGURE 7.
mGPDH produces superoxide to both sides of the mitochondrial inner membrane. a, superoxide anion (O2˙̄) does not readily traverse lipid bilayers, and two distinct methods reveal to which side of the mitochondrial inner membrane superoxide is produced. Superoxide produced toward the intermembrane space can be identified as the fluorescent signal from Amplex UltraRed oxidation that is dependent upon exogenously added superoxide dismutase. Superoxide produced toward the matrix can be measured indirectly as the rate of inactivation of the matrix enzyme aconitase, whose catalytic iron-sulfur cluster is highly sensitive to superoxide. GF, FAD site in mGPDH; GQ, Q-binding site in mGPDH; SOD, superoxide dismutase; AUR, Amplex UltraRed. b, calibration of the rate of aconitase inactivation to the rate of superoxide production toward the matrix for site IF and site IIIQo in skeletal muscle mitochondria. Superoxide production rates were determined from measured H2O2 production rates, assuming that two superoxides were produced and dismutated for each H2O2 detected and that site IIIQo generates superoxide equally toward the matrix and the intermembrane space, whereas site IF produces superoxide only toward the matrix (see a). Therefore, using identical conditions to measure rates of H2O2 production and aconitase inactivation, total rates of production for site IF (black circles) and half of the total rates of production for site IIIQo (white squares) were used to calibrate their respective rates of aconitase inactivation. Site IF was driven by 5 mm malate in the presence of 2 μm FCCP and either 0.6 or 4 μm rotenone. Site IIIQo was driven by 15:85 or 35:65 ratios of succinate/malonate (5 mm total dicarboxylate) in the presence of 4 μm rotenone and 2.5 μm antimycin A. A linear equation was used to fit these data (21). Data are means ± S.E. (n = 3). A similar calibration was made using brown fat mitochondria (not shown). c, calculated percentage of superoxide produced by mGPDH directed toward the matrix in skeletal muscle mitochondria (white bar) and brown fat mitochondria (black bar). The linear calibration in b was applied to rates of aconitase inactivation by mGPDH during oxidation of 1.7 mm glycerol phosphate in the presence of 4 μm rotenone, 2.5 μm antimycin A, 2 μm myxothiazol, and 250 nm free calcium. The estimated rate of matrix-direct superoxide production by mGPDH was then compared with twice the peak rates of H2O2 production by mGPDH in Fig. 4c to yield the percentage of superoxide generated by mGPDH that is directed toward the matrix. There was no significant difference between tissues (p > 0.05; unpaired t test). Data are means ± S.E. (error bars) (n = 3). d, calculated percentage of superoxide produced by mGPDH that was directed toward the intermembrane space in skeletal muscle mitochondria (white bar) and brown fat mitochondria (black bar) as defined by the percentage of the total rate that was dependent upon exogenous superoxide dismutase (see a). Data are means ± S.E. (n = 5 for muscle; n = 4 for brown fat).

