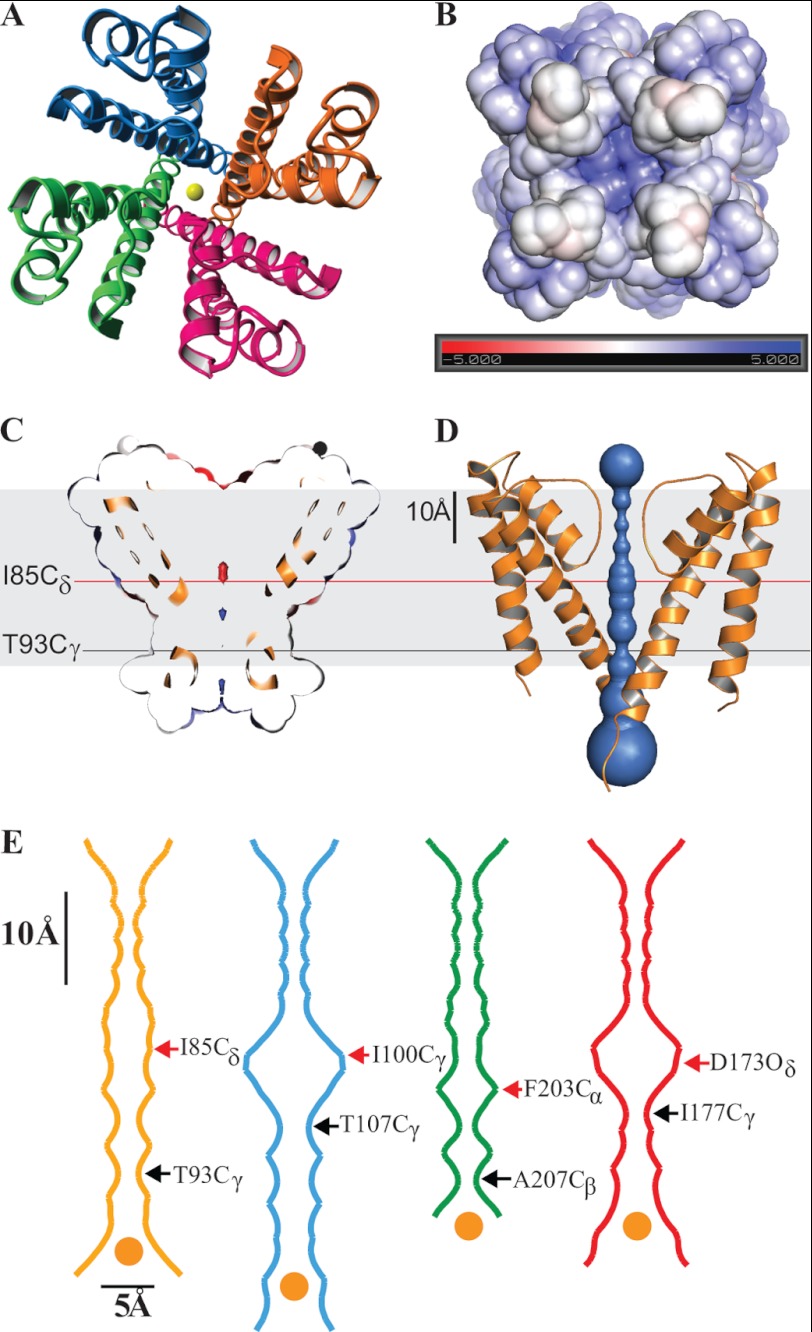
FIGURE 2.
KvLm PM has its filter gate in a conductive conformation and its cytoplasmic activation gate closed. A, crystal structure of the KvLm PM tetramer seen from the extracellular surface with subunits in red, green, blue, and orange. K+ ions at the center of the pore are in yellow. B, end view of the tetramer from the cytoplasm. The electrostatic surface potential of the KvLm tetramer computed in a bilayer environment (22) that mimics the crystallization condition (0.5 m KCl) rendered on a solvent-accessible surface representation. The electrostatic scaling is −5 kcal/mole (red) to +5 kcal/mole (blue). C and D, side view of a cross-section through the middle of the tetramer exposing the channel lumen. The indicated residues form the tighter and wider constrictions. The contour depicted in gray represents the lipid bilayer. E, cavity radius profile of KvLm (gold) and three other K+ channels crystallized in a closed conformation: KcsA (20) (Protein Data Bank code 1K4C, blue), MlotiK1 (26) (Protein Data Bank code 3BEH, green), and an inward rectifier (27) (Protein Data Bank code 3JYC, red). The indicated residues form the tighter and wider constrictions. The dehydrated K+ ion depicted in yellow at the entrance to the activation gate is drawn to scale (1.33 Å radius) (39). The contour depicted in gray represents the lipid bilayer.

