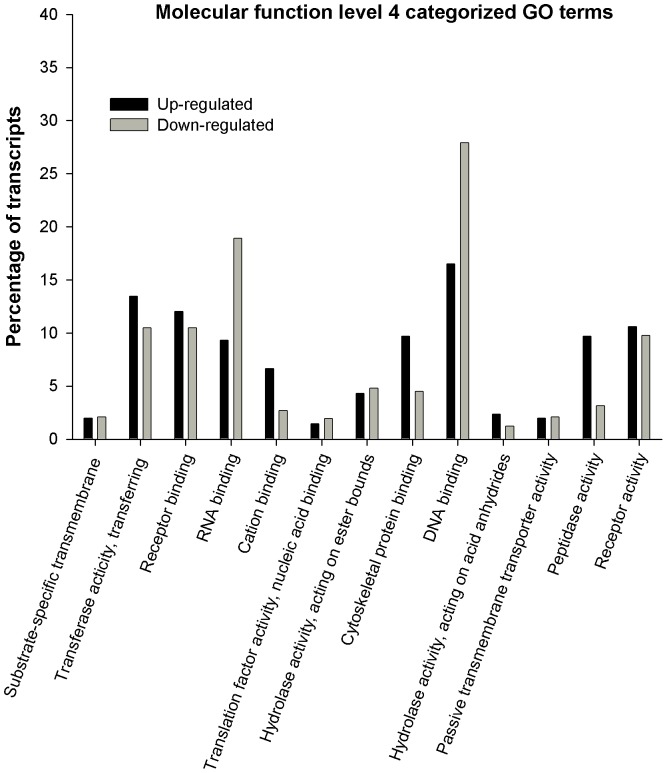
Figure 3. Gene Ontology (GO) bar chart of differentially expressed genes between parthenotes and fertilised embryos.
Gene Ontology (GO) bar chart of differentially expressed genes between parthenotes and in vivo fertilised embryos. Genes upregulated and downregulated in parthenotes embryos that are categorised by GO term “Molecular function” level 4.

