

Abstract
A thermostabilized variant (UVF) of the engrailed homeodomain (EnHD) was previously engineered by Mayo and co-workers. The melting temperature of the non-natural, designed protein is 50°C higher than the natural wild-type protein (>99 vs. 52°C), and the two proteins share 22% sequence identity. We have performed extensive (1 μs) all-atom, explicit solvent molecular dynamics simulations of the wild-type and engineered proteins to investigate their structural and dynamic properties at room temperature and at 100°C. Our simulations are in good agreement with nuclear magnetic resonance data available for the two proteins [nuclear Overhauser effect crosspeaks (NOEs), J-coupling constants and order parameters for EnHD; and NOEs for UVF], showing that we reproduce the backbone dynamics and side chain packing in the native state of both proteins. UVF was more dynamic at room temperature than EnHD, with respect to both its backbone and side chain motion. When the temperature was raised, the thermostable protein maintained this mobility while retaining its native conformation. EnHD, on the other hand, was unable to maintain its more rigid native structure at higher temperature and began to unfold. Heightened protein dynamics leading to promiscuous and dynamically interchangeable amino acid contacts makes UVF more tolerant to increasing temperature, providing a molecular explanation for heightened thermostability of this protein.
Keywords: molecular dynamics, protein engineering, simulation validation, thermostabilized proteins
Introduction
The engrailed homeodomain (EnHD) is a popular target for protein folding studies, both experimental and computational, due to its ultrafast folding and unfolding times as well as its low melting temperature and ΔGD-N [Tm = 52°C, ΔGD-N = 1.7 kcal/mol (Mayor et al., 2000, 2003b; Gianni et al., 2003; DeMarco et al., 2004; McCully et al., 2008, 2010)]. In addition, its native state structure and dynamics have been characterized extensively (Mayor et al., 2003a; McCully et al., 2008, 2010; Religa, 2008). Over the past decade, this protein has been re-engineered to increase its thermostability by the Mayo group using full-sequence computational design (Marshall and Mayo, 2001; Marshall et al., 2002; Gillespie et al., 2003; Shah et al., 2007). They used a limited amino acid library that selected only hydrophobic amino acids (Ala, Val, Leu, Ile, Phes, Tyr, Trp) for buried residues, polar and charged amino acids for the surface and statistically probable amino acids as helix-capping residues. In 2007, the group created UVF, which is very stable with a Tm > 99°C and ΔGD-N = 4.2 kcal/mol (Shah et al., 2007) and 22% sequence identity to EnHD (Fig. 1). Most of the mutations relative to EnHD remove polar residues from the buried regions and hydrophobic residues from the surface. A nuclear magnetic resonance (NMR) structure of UVF along with a set of nuclear Overhauser effect crosspeaks (NOEs) was published simultaneously (Shah et al., 2007).
Fig. 1.

Sequence and structure of EnHD and UVF. (A) Alignment and ClustalW score for the sequences of both proteins. The EnHD sequence is colored by helix (HI: 10–22 red; HII: 28–38 green; HIII: 42–53 blue). Hydrophobic residues in EnHD that were mutated to polar residues in UVF are colored in cyan on the UVF sequence; polar to hydrophobic mutations are colored green. (B) Experimental structures (EnHD: 1enh crystal structure, top; UVF: 2p6j NMR structure, bottom) are shown colored by helix with non-hydrogen side chain atoms shown as ball and sticks. (C) Surface residues in EnHD (top) and UVF (bottom) are colored as hydrophobic (Ala, Val, Leu, Ile, Phe, Tyr, Trp; green) or polar (cyan). Buried residues (8, 12, 16, 19, 20, 26, 31, 34, 35, 38, 40, 44, 45, 48, 49, 52) are colored gray. (D) Buried residues in EnHD (top) and UVF (bottom) are colored by polar (cyan) and hydrophobic (green). Surface residues are colored gray. UVF was designed to remove all hydrophobic residues from the surface and polar residues form the core. Hydrophobic/polar residues are more segregated between buried and surface residues in UVF, and the hydrophobic core is more loosely packed.
This pair of proteins provides an excellent opportunity to investigate the detailed structural and dynamic bases for the thermostability of such engineered proteins and thermostabilized proteins in general. Differences in the sequences hint at reasons for increased thermostability: hydrophobic residues in the core and not on the surface increase the strength of the hydrophobic effect, and electrostatic interactions on the surface and at helix-capping residues further increase stability (Marshall and Mayo, 2001; Marshall et al., 2002). Mayo and coworkers attributed the increased melting temperature to decreasing the overall charge of the protein from +7 to 0 and to incorporating more favorable electrostatic interactions. These new interactions included additional salt bridges between surface side chains as well as side chain–backbone interactions that stabilized helix-dipoles and capped the helices. Yet, a full description of the proteins' dynamics at room temperature and how the thermostabilized proteins maintain a folded structure at higher temperatures is lacking. To that end, we have performed all-atom, explicit solvent molecular dynamics (MD) simulations of the two proteins at 25 and 100°C totaling 1 μs of simulation time. In addition, we have compared our simulations with NMR observables where they are available: NOEs, J-coupling constants and backbone amide S2 order parameters for EnHD; and NOEs for UVF. Our simulations are in good agreement with the available NMR data for both proteins, validating the proteins' backbone movement and tertiary interactions.
Our native simulations of the two proteins indicate that UVF is more dynamic at room temperature than EnHD. When the temperature was increased to 100°C, EnHD became more mobile while the engineered protein maintained dynamics on par with what was observed at room temperature. The increased dynamics in EnHD at the higher temperature caused it to lose many of its native core contacts and unfold. In contrast, the thermostabilized protein maintained its more non-specific and dynamic core interactions with increased temperature, and the structure easily tolerated the increase. In a sense, the more promiscuous and dynamic contacts in the designed protein better absorbed energy.
Methods
Simulation protocol
All simulations were performed using our in-house MD software, in lucem molecular mechanics (ilmm) (Beck et al., 2000–2012), with the Levitt et al. force field (Levitt et al., 1995). The starting structure for simulations of EnHD was the crystal structure (PDB ID: 1enh), which was determined to a resolution of 2.1 Å and includes residues 3–56 (Clarke et al., 1994). A set of native simulations were also begun from model 1 of the NMR ensemble of EnHD (PDB ID: 2jwt) (Religa, 2008) to control for any differences due to crystal vs. NMR structures. The simulations of UVF began with the first model of the NMR ensemble (PDB ID: 2p6j) (Shah et al., 2007). The UVF structure were renumbered to align with EnHD's PDB numbering, and they are discussed using residues 5–56 instead of 1–52 to avoid confusion.
Each system was prepared as per our standard protocols (Beck and Daggett, 2004) using a water box that extended 10 Å past the edge of the protein on all sides filled with flexible, explicit water molecules (Levitt et al., 1997) at a density consistent with the experimentally determined liquid–vapor coexistence curve (25°C: 0.997 g/ml; 100°C: 0.958 g/ml) (Kell, 1967). Energies and forces were calculated using 2 fs time steps. The NVE (constant number of particles, volume and total energy) microcanonical ensemble was employed using periodic boundary conditions. An 8 Å force-shifted cutoff was used for non-bonded interactions (Beck et al., 2005), and the non-bonded pair list was updated every two steps. Structures were saved every 1 ps for analysis, and five independent simulations were performed for 50 ns each for both EnHD and UVF at 25 and 100°C. The EnHD NMR control structure was only simulated at 25°C (five 50-ns simulations), and those simulations will not be discussed in depth. Additional control simulations at 225°C verified that the thermostabilized protein did indeed unfold at very high temperature, but they are not discussed here. The simulation time totals 1 μs and resulted in 1 000 000 structures for detailed analysis.
Calculation of NMR comparables
NMR experiments were performed on a 61-residue construct of EnHD (residues −1 to 59) and deposited in the Biological Magnetic Resonance Data Bank (BMRB, accession number 15 536 and block id 276 091 for PDB 2jwt). This dataset contains 45 3JHNHα coupling constants, 58 S2 N-H order parameters and 675 NOEs. The coupling constants and NOEs were measured at 5°C and the order parameters at 25°C. In addition, 1151 NOEs measured at 20°C were found for UVF in the BMRB's Filtered Restraints Database (Doreleijers et al., 2005) (BMRB block ids 449 656 and 449 657). Similar values were calculated from the atomic coordinate data in our simulations to compare with these experimental observables.
J-coupling constants were calculated from backbone ϕ angles using the Karplus equation (Karplus, 1959; Beck et al., 2008). 3JHNHα was calculated at each step and averaged over the simulation for each residue to obtain 〈3JHNHα〉. Experimental coupling constant data were available for residues 10–55 of EnHD except Glu37.
The S2 order parameters were calculated from the MD simulations as the autocorrelation of the backbone N–H bond vector and side chain methyl group axis over a sliding, finite time window (Lipari and Szabo, 1982; Levitt, 1983; Wong and Daggett, 1998). We calculated S2 and S2axis for EnHD using a sliding window of 10 ns. Before doing the S2 calculations, all structures were aligned on the backbone atoms (N, Cα, C, O) of the core (residues 8–53) to remove rotational and translational motion. Experimental amide S2 order parameters were available for all residues in our EnHD construct, so we compared S2 as measured from our simulations to experiment for residues 3–56, with the exception of Pro 4 (for which there is no N–H bond).
A total of 675 NOEs were deposited for EnHD, 654 of which correspond to residues in our construct, and 1151 NOEs were reported for UVF. We calculated the distance between the closest equivalent protons in the NOE using an 〈r−6〉 weighted distance. If this distance was <5.5 Å, which was the longest cutoff published for the EnHD experimental set, the NOE was considered satisfied. For UVF, the NOE was considered satisfied if r was ≤ 5.5 Å or the rfar value of the NOE from the experimentally derived NOE list, whichever was longer (the largest rfar was 6 Å). To calculate NOEs for the crystal structure of EnHD, hydrogen atoms were added and minimized for 100 steps using the steepest descent minimization.
Simulation analysis
The root-mean-square deviation of the Cα atoms (Cα RMSD) to the simulation starting structure (crystal structure for EnHD or NMR structure for UVF) was calculated for the core residues (8–53) of all proteins. The calculation was limited to the core residues because the N- and C-termini have large movements that are not representative of the dynamics of the structured region of the proteins. In addition, this truncation allows us to directly compare the RMSD between both proteins, as their number of residues differs. The RMSD was also calculated between all structures in the four sets of simulations at 50-ps granularity and then averaged to give the all-vs.-all average core Cα RMSD. This was done so better depict how much backbone motion there was in the simulation rather than how much variation there was from the starting structure. The Cα root-mean-square-fluctuation (Cα RMSF) about the mean structure over time was also calculated for the core residues. The mean structure for each protein was calculated by averaging the coordinates for each Cα atom across simulation time.
Contacts were counted and classified in several different ways. First, contacts were defined as native or non-native based on whether they occurred in the starting structure. They were also classified based on whether the contacting atoms were in the main chain (N, Cα, C, O) or side chain. Atoms were considered in contact for carbons that were ≤5.4 Å apart or non-carbon atoms that were ≤4.6 Å apart. Hydrogen atoms were not considered, nor were interactions within a residue or between neighboring residues. Residues were considered in contact if they contained at least one contacting atom pair.
Next, side chain–side chain contacts were further classified as making hydrogen bonded, hydrophobic or ‘other’ interactions. Three atoms were defined as being in a hydrogen bond if the hydrogen and acceptor atoms were <2.6 Å, the donor–hydrogen–acceptor angle was within 45° of linearity, the charges on the donor and acceptor were <–0.3 and the charge on the hydrogen was >+0.3. Two carbons were defined as participating in a hydrophobic interaction if they were <5.4 Å apart and each carbon was bound to at least one hydrogen atom. If two non-hydrogen atoms that did not satisfy the previous two contact types were <4.6 Å apart, they were defined as making an ‘other’ interaction. Finally, the core residues (8–53) were further classified by whether they were buried (8, 12, 16, 19, 20, 26, 31, 34, 35, 38, 40, 44, 45, 48, 49, 52) or on the surface (9–11, 13–15, 17, 18, 21–25, 27–30, 32, 33, 36, 37, 39, 41–43, 46, 47, 50, 51, 53).
Results
Validation of simulations: comparison with NMR observables
J-coupling constants
3JHNHα coupling constants averaged over all five native simulations of EnHD at 25°C are reported in Fig. 2A, and the correlations are reported in Table I. J-coupling constants calculated from the crystal structure and NMR ensemble (25 structures) are also plotted (Fig. 2A). Helical residues (10–22, 28–38, 42–55) had the best agreement with experiment and were consistently <6.0 Hz, as expected for helices (Pardi et al., 1984). The correlations ranged from 0.56 to 0.70, and the average over all five simulations was 0.67. Although some correlations were low, the RMSD was always within 1.5 Hz, which is the error range for such experiments and the conversion of backbone ϕ angles from MD to a coupling constant using the Karplus equation.
Fig. 2.

3JHNHα-coupling constants and S2 amide order parameters for EnHD. (A) Coupling constants are plotted as measure experimentally and as calculated for the crystal structure, NMR structures and MD simulations at 25°C for residues 10–55, except for Glu37 for which no experimental data were available. Agreement is best for helical areas (residues 10–22, 28–38, 42–55), and correlations over all 45 residues were 0.83, 0.94 and 0.67 for the crystal structure, NMR structures and MD, respectively. (B) Order parameters are plotted for residues 3–56, with the exception Pro 4. Helical regions have very good agreement with the experiment. The correlation between the experiment and the MD simulations for the 53 residues was 0.87.
Table I.
EnHD comparison between simulation and experiment
| Temp. (K) | Run | Sim. length (ns) |
3J(HNHα)a |
S2 (10 ns)b |
NOEsc |
|||
|---|---|---|---|---|---|---|---|---|
| Correlation | RMSD (Hz) | Correlation | RMSD | % NOEs satisfied | Mean viol dist. (Å) | |||
| 298 | 1 | 50 | 0.59 | 1.32 | 0.86 | 0.08 | 83.8 | 0.90 |
| 2 | 50 | 0.70 | 1.17 | 0.83 | 0.10 | 87.6 | 1.10 | |
| 3 | 50 | 0.61 | 1.28 | 0.91 | 0.07 | 92.0 | 0.45 | |
| 4 | 50 | 0.65 | 1.23 | 0.80 | 0.10 | 91.1 | 0.82 | |
| 5 | 50 | 0.56 | 1.35 | 0.83 | 0.09 | 86.2 | 1.01 | |
| All | 250 | 0.67 | 1.21 | 0.87 | 0.08 | 92.0 | 0.65 | |
| 1enh (Crystal) | 1d | 0.83 | 0.90 | 96.8 | 0.43 | |||
| 2jwt (NMR) | 25d | 0.94 | 0.55 | 98.8 | 0.19 | |||
a3JHNHα coupling constants were calculated based on the backbone ϕ angle and the Karplus equation, and the correlation and RMSD to the experimental values are reported.
bS2 order parameters were calculated using a sliding 10-ns window, and the correlation and RMSD to the experimental values are reported. S2 was not calculated for 1enh and 2jwt because there were not enough structures.
cAn NOE was considered satisfied if the 〈r−6〉 distance between closest equivalent protons was ≤ 5.5 Å. For those that were not satisfied, the mean violation distance is reported.
dNumber of structures, not simulation length.
The residues with the worst agreement were Arg24, Tyr25, Leu26 and Thr27 in the HI–HII loop. This was due to Leu26 pointing out past HIII rather than into the core of the protein. Its rotation disrupted the ϕ angles of the surrounding residues. Leu38, Gly39 and Asn41 in the HII–HIII loop also had poor agreement with experiment. In most simulations, Asn 41 alternated between ϕ ≈+70° and −50°. In simulations with the best agreement, Asn 41 spent the most time with ϕ ≈+70°, which corresponds to values of 3JHNHα near the experimental value of 6.8 Hz. However, in several simulations, Asn 41 favored ϕ ≈+140° where J is very low (≈ 2).
Order parameters
The S2 order parameter describes the amount of motion of a particular bond vector where values range from 0 (no order) to 1 (completely rigid). S2 values for the backbone amide bonds are shown in Fig. 2B as calculated for all five native EnHD simulations using a 10-ns window. Correlations with experiment for each simulation and for all simulations at 25°C are presented in Table I. Experimentally derived S2 values are available for all residues in our construct, with the exception of Pro 4. Overall, the correlation improved as the time window was lengthened in our S2 calculation, which is to be expected since the autocorrelation should be taken over a long time limit.
Correlations with experiment ranged from 0.80 to 0.91 for the five simulations independently, and the correlation was 0.87 when they were pooled together. The three helices and the HI–HII loop had the best agreement with experiment. The N- and C-termini as well as the HII–HIII loop deviated from the experimental values. Since our construct is missing four residues on the N-terminus (−1 to 2) and three on the C-terminus (57 to 59), it is reasonable to suspect that these missing residues affect the motions of the termini. Residues in the HII–HIII loop, particularly Leu38 and Gly39, were less rigid in our simulations than their experimental values would suggest.
Nuclear Overhauser effect crosspeaks
The percentage of NOEs that were satisfied by our simulations of EnHD and the average violation distances for those that were not satisfied are provided in Table I. When the five native simulations were all pooled together, 92% of the 654 reported NOEs for our construct were satisfied. The mean violation distance for the NOEs that were not satisfied was 0.65 Å.
There were only three individual NOEs that were violated by >1 Å in all five simulations of EnHD: Glu19 Hγ–Phe49 Hζ, Leu26 Hδ–Trp48 Hε and Arg53 H–Lys55 Hε. The core packing was looser in our simulations than in the crystal structure or NMR ensemble, and Phe49, in particular, flipped around in the hydrophobic core, sometimes moving farther away from Glu19 than in the crystal or NMR structures. The Leu26–Trp48 NOE was not satisfied in the crystal structure due to a flipped orientation of Leu26, which is maintained in the simulations. Similarly, Lys55 adopts a rotamer that tilts the terminal amine toward the backbone of Arg53 in the crystal and NMR structures without making any direct contacts, but it was very dynamic in the simulations and that orientation was not maintained.
NOE satisfaction was also calculated for UVF and is reported in Table II. NOE satisfaction was 95% at both 25 and 100°C, and all 500 ns of simulation time pooled together had nearly as many NOEs satisfied as the NMR ensemble (96 vs. 97%). Residues Glu14, Glu18, Arg22 and Glu42 had no long-range (between residues with a sequence separation of ≥5) NOEs satisfied by simulation or the NMR ensemble. Gly39 had 0 of 8 long-range NOEs satisfied by simulation but 100% satisfaction in the NMR ensemble. All of these residues are found on the surface of UVF. In our simulations, Glu18 and Arg22 often formed a salt bridge with each other, Glu14 and Glu42 interacted with solvent, and Gly 39 was loosely part of HII.
Table II.
UVF comparison between simulation and experiment
| Temp. (K) | Run | Sim. length (ns) | NOEsa |
|
|---|---|---|---|---|
| % NOEs satisfied | Mean viol. dist. (Å) | |||
| 298 | 1 | 50 | 91.1 | 1.99 |
| 2 | 50 | 88.0 | 2.10 | |
| 3 | 50 | 93.3 | 1.45 | |
| 4 | 50 | 94.2 | 1.15 | |
| 5 | 50 | 92.4 | 1.84 | |
| All | 250 | 95.0 | 1.25 | |
| 373 | 1 | 50 | 92.7 | 1.48 |
| 2 | 50 | 92.9 | 1.51 | |
| 3 | 50 | 93.4 | 1.35 | |
| 4 | 50 | 92.7 | 1.81 | |
| 5 | 50 | 94.6 | 1.41 | |
| All | 250 | 95.1 | 1.41 | |
| All simulations | 500 | 95.8 | 1.31 | |
| 2p6j (NMR) | 25b | 97.0 | 0.47 | |
aAn NOE was considered satisfied if the 〈r−6〉 distance between closest equivalent protons was ≤5.5 Å or the distance specified in by the restraint, whichever was farther. For those that were not satisfied, the mean violation distance is reported.
bNumber of structures, not simulation length.
Dynamics of EnHD vs. UVF
Backbone motion
At room temperature (25°C), EnHD had a lower core (residues 8–53) Cα RMSD to the starting structure [2.3 ± 0.6 (s.d.) Å] than its thermostabilized counterpart (3.3 ± 0.7 Å) over the last 20 ns of the simulations and when calculating the Cα RMSD between all structures in the sets of five simulations (2.1 ± 0.6 vs. 2.7 ± 0.7 Å for EnHD and UVF, respectively) (Fig. 3A–C). UVF was more mobile at room temperature, with larger rearrangements of the three helices. HI and HII did not move apart, but they did sometimes tilt relative to one another, and HIII slid across helices I and II. In EnHD, there was a loosening of the structure relative to the crystal structure; however, all three helices held their original conformations with HI and HII parallel and HIII docked across them. Notably, this difference was not simply due to crystal vs. NMR starting structures; when simulations starting from the EnHD's NMR structure were performed, the core Cα RMSD was 2.5 ± 0.5 Å for the final 20 ns of all fiev 50-ns simulations. In the last 20 ns of the simulations at 100°C, the core Cα RMSD of EnHD increased to 5.0 ± 0.9 Å. Not only did the core Cα RMSD itself increase, but so did its standard deviation, indicative of more structural heterogeneity at the higher temperature. However, the core Cα RMSD of UVF was unchanged with a 75°C increase in temperature.
Fig. 3.

Core Cα RMSD/F at 25 and 100°C. (A) The average Cα RMSD of the core residues (8–53) over the last 20 ns of each of the five independent simulations is plotted for EnHD and UVF at 25 and 100°C with the standard deviation denoted by error bars. (B) The core Cα RMSD was calculated between all structures at 50-ps granularity for each set of five 50-ns simulations. The average values and standard deviations are plotted for EnHD and UVF at 25 and 100°C. (C) The core Cα RMSD was averaged at each time point over the five independent simulations and is plotted over time for both proteins at both temperatures. The RMSD was higher for UVF at 25°C, relative to EnHD. When the temperature was raised to 100°C, the RMSD increased for EnHD as it unfolded. However, in the case of the thermostabilized proteins, there was no change in RMSD when the temperature was raised. (D) The core Cα RMSF is plotted for each residue in EnHD and UVF at 25°C. The RMSF was lower for EnHD than UVF in HI and HII, indicating less fluctuation in the backbone.
The Cα RMSF was calculated for the core residues over all simulations at 25°C (Fig. 3D). Again, residues in EnHD had lower fluctuations about the mean structure than those in UVF, indicative of a more rigid structure. As expected, the most rigid regions were the three helices, where the amide atoms are involved in hydrogen bonding.
Core contacts analysis
Native (present in the simulation starting structure) and non-native contacts in the 25 and 100°C simulations of EnHD and UVF are plotted as maps in Fig. 4A–D, with native contacts below the diagonal and non-native above. The three helices are apparent along the diagonal with i → i + 2, i + 3 and i + 4 contacts present during the entire simulation. The off-diagonal contacts are indicative of the HI–HII interactions and the interactions of HIII with HII and the C-terminus of HI. While there were more non-native contacts present in UVF at both temperatures, these contacts were present in the same regions as the native contacts. This consistency suggests that there was no loss of overall structure, but rather there were local rearrangements in a fluid core. At 100°C, EnHD made many non-native contacts, but they were smeared all over the protein, indicative of non-native tertiary structure and unfolding. Although EnHD had more contacts on average than UVF (Fig. 5), it made fewer unique contacts (Fig. 4E). This difference suggests that UVF made more promiscuous contacts, yielding a more fluid core. There were more unique contacts at 100°C than at 25°C for both proteins, indicative of increased fluidity in the protein core as the temperature rose.
Fig. 4.

Native, non-native and unique contacts for EnHD and UVF. Fraction time in contact for the 25°C simulations of (A) EnHD and (B) UVF and the 100°C simulations of (C) EnHD and (D) UVF. The box indicates the core residues (8–53). Native contacts (present in the starting structure) are plotted below the diagonal and non-native contacts above. Fraction time in contact ranges from 0.0 (white) to 1.0 (black). (E) The total number of unique core residue–residue contacts for EnHD and UVF at 25 and 100°C with error bars indicating the standard deviation across simulations. UVF had more unique residue–residue contacts than EnHD at 25°C, particularly non-native ones. When the temperature was raised, EnHD picked up more contacts in non-native regions of the contact plot while UVF increased the number or contacts without losing its overall tertiary structure.
Fig. 5.

Main chain and side chain contacts at 25 and 100°C. Total number of contacts for the core residues (8–53) of EnHD and UVF at 25 and 100°C are plotted. The solid portions of the bars indicates native contacts (present in the starting structure) and white portion indicates non-native contacts. The error bars indicate the standard deviation over time for the native contacts (below) and total (above). Contacts are classified as main chain–main chain, main chain–side chain, side chain–side chain and total.
Figure 5 shows the average number of contacts per frame in simulations at 25 and 100°C organized by whether they occurred between atoms in the main chain (N, Cα, C, O) or side chain and further classified them as native (solid region) or non-native (white region). EnHD retained more of its native contacts at 25°C, while UVF gained more non-native contacts to replace any lost native contacts, particularly when considering side chain–side chain contacts only. UVF had little change in the number of contacts over all eight classifications between 25 and 100°C. However, EnHD lost contacts, especially native side chain contacts, at 100 relative to 25°C while maintaining main chain–main chain contacts.
Side chain contacts were further analyzed by the type of contact and whether contacts were made between buried residues, between surface residues or between the buried and surface residues (Fig. 6). While UVF had about the same number of buried hydrophobic side chain contacts as EnHD, EnHD had significantly more buried ‘other’ contacts (Fig. 6A). This was due to limiting the core to hydrophobic residues in the design of UVF. EnHD lost buried contacts, especially hydrophobic, at 100°C relative to 25°C, consistent with unfolding. EnHD and UVF both had an average of zero buried hydrogen bonds, which is due to the fact that the buried polar residues in EnHD did not form hydrogen bonds with each other. On the surface, there was no significant difference between EnHD and the thermostabilized variant, despite having eight polar to hydrophobic mutations in UVF (Fig. 6B). However, there was a significant loss in hydrogen bonds and ‘other’ interactions between buried and surface residues in UVF compared with EnHD (Fig. 6C). Overall, there were more hydrophobic interactions between buried residues and more hydrogen bonds and non-specific interactions between surface residues for both proteins (Fig. 6A and B), as expected. There were few differences in contacts between the simulations at 25 vs. 100°C, especially for UVF.
Fig. 6.

Types of side chain contacts at 25 and 100°C. Total number of contacts for the side chains of the core residues (8–53) of EnHD and UVF at 25 and 100°C are plotted. Contacts were further classified by whether they were between residues that were (A) both buried (residues 8, 12, 16, 19, 20, 26, 31, 34, 35, 38, 40, 44, 45, 48, 49, 52), (B) both on the surface (9–11, 13–15, 17, 18, 21–25, 27–30, 32, 33, 36, 37, 39, 41–43, 46, 47, 50, 51, 53) or (C) one buried and one on the surface. Contacts are plotted left-to-right by whether they were hydrogen bonds, hydrophobic interactions, other interactions or the total of the previous three groups. Error bars indicate the standard deviation across simulations.
Hydrophobic side chain motion was measured by calculating S2axis for methyl groups in EnHD and UVF. Histograms of the S2axis values are plotted for EnHD and UVF at both temperatures (Fig. 7). When the temperature was raised, S2axis shifted toward zero for EnHD, indicative of more side chain motion. However, for UVF, there was little to no change in S2axis between 25 and 100°C.
Fig. 7.

Side chain methyl order parameters. S2axis values were calculated for all of the methyl groups in EnHD (A) and UVF (B) at 25°C (lighter) and 100°C (darker). Fifteen residues and 24 methyl groups in EnHD: Thr6, Ala7, Leu13, Ala14, Leu16, Leu26, Thr27, Leu34, Leu38, Leu40, Ala43, Ile45, Ile47, Ala54, Ile56; 12 residues and 20 methyl groups in UVF: Met5, Val12, Leu16, Val20, Ile26, Thr27, Leu31, Ala35, Leu38, Leu40, Ala44, Ile45.
The increased native backbone motion in UVF relative to EnHD at 25°C is reflected in the stereo-images of the final structures from the five independent simulations aligned on HI and HII (Fig. 8). They may be seen in cross-eyed 3D by overlapping all six structures and the black boxes in the lower right corner. There was little difference between the backbone motion in UVF as the temperature increased from 25 to 100°C. However, EnHD became more heterogeneous at 100°C relative to 25°C as it began to unfold (Fig. 9). In Fig. 9, the final (50 ns) structures from the high-temperature simulations of EnHD show HIII pulling away from HI and HII and disruptions in general to the packing of the helices, consistent with the first steps in unfolding. UVF, on the other hand, maintained a folded, three-helix bundle conformation with lower core Cα RMSDs to the starting structure.
Fig. 8.

Stereo image of backbone mobility in EnHD and UVF. EnHD (left) and UVF (right) are colored by helix (HI red, HII green, HIII blue). The simulation starting structures are shown (top) along with the 50-ns structures from the five independent simulations at 25°C (middle) and 100°C (bottom) overlaid and aligned on HI and HII. UVF was more mobile at both temperatures than EnHD at 25°C, but EnHD unfolded at 100°C whereas UVF did not. The set of six images can be seen in cross-eyed stereo by overlapping the two black boxes in the lower right corners.
Fig. 9.
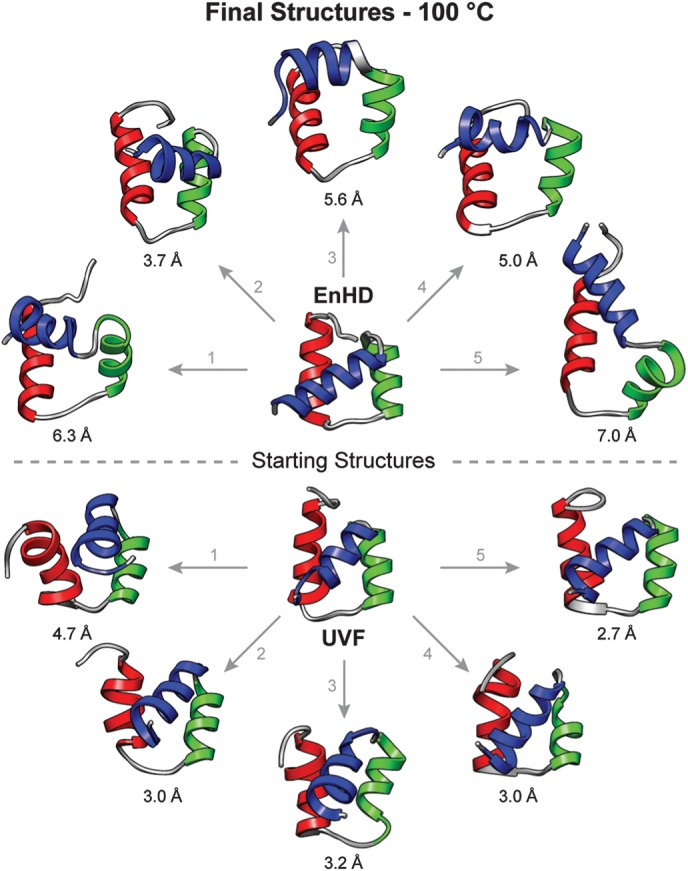
Final structures of EnHD and UVF from the 100°C simulations. The starting structure and final (50 ns) structure from each of the five independent runs of EnHD (above) and UVF (below) are shown colored by helix (HI red, HII green, HIII blue). The core Cα RMSD of each structure to the starting structure is given.
Discussion
Increased backbone dynamics and promiscuous core contacts in UVF allowed it to maintain its native, folded structure in our simulations at high temperature, showing little difference in behavior with a 75° increase in temperature. We validated our native simulations by comparing available NMR data to corresponding properties from our simulations. The 3JHNHα coupling constants and backbone amide S2 order parameters calculated from 250 000 structures from our five independent MD simulations of EnHD agree well with the experiment. These measurements demonstrate that our simulations reproduce the backbone structure (ϕ angles) and main chain dynamics (N–H bond motion) that have been observed by NMR (Religa, 2008). The three helices were intact in our simulations, as reflected in coupling constants of <6.0 Hz (Pardi et al., 1984) and high-order parameters in the helical regions. The HII–HIII loop showed some disagreement with the NMR observables, particularly due to residues Leu38 and Gly39, which were more mobile in our simulations than the experimental observables suggest. Our good agreement with NOEs for EnHD and UVF show that both proteins maintain the overall structure and packing of the protein in our simulations.
EnHD was more rigid in our simulations at 25°C than its engineered counterpart (Fig. 8). In particular, there was less fluctuation in the backbone as observed by a lower core Cα RMSD and Cα RMSF in EnHD relative to UVF at 25°C (Fig. 3). When the temperature was raised to 100°C, EnHD partially unfolded, reaching core Cα RMSDs > 5 Å by the end of the simulations, whereas UVF remained as stable as in the simulations at 25°C. UVF had more non-native contacts and more diversity in contacts than EnHD (Figs 4 and 5). It is important to note that while UVF accumulated many non-native contacts, these contacts were still in the same regions as the native contacts (HI to HII, and HII to HII and the C-terminus of HI), and the protein's NOEs were well satisfied. Together, these data indicate that there were no large structural changes in UVF that would indicate it was unfolding. In EnHD at 100°C, however, non-native contacts were formed between all regions of the protein, indicative of loss of native tertiary structure and unfolding. The increased backbone flexibility and higher number of non-native and unique contacts in UVF than EnHD reflect a more fluid, flexible core in the thermostabilized protein.
While the main chain mobility was higher in UVF relative to EnHD, the effect was enhanced further in the side chain motions. This increased motion of the buried side chains in the core of UVF relative to EnHD can be observed qualitatively when looking at structures from the simulations at 25 and 100°C (Fig. 8). The types of residues in the core of the different proteins help shed light on why fluidity is increased in UVF (Fig. 6). In designing UVF, Mayo and coworkers used a restricted library of amino acids that would only allow hydrophobic residues in the core and polar or charged residues on the surface (Marshall and Mayo, 2001; Shah et al., 2007). Six mutations in UVF increased the hydrophobic content of the core, Gln12Val, Glu19Phe, Arg31Leu, Ser35Ala, Gln44Ala, Trp48Phe and Lys52Phe. None of these residues in EnHD formed hydrogen bonds with each other; instead they interacted with surface polar and buried hydrophobic residues. Removing polar-to-hydrophobic contacts is entropically favorable, but why removing buried-to-surface hydrogen bonds results in heightened thermostability is less straightforward. In EnHD, the small movement of a buried polar residue could greatly weaken the contribution of a hydrogen bond with a surface residue in maintaining a folded structure. If the buried polar residue were to exchange hydrogen bonding partners on the surface, this new non-native interaction might stabilize a conformation of the residue that disrupts the native packing of the hydrophobic core. In contrast, in UVF, a small shift in a buried residue would simply exchange hydrophobic binding partners with a residue nearby and maintain a favorable energetic contribution. In this way, the thermostabilized protein could withstand the increased motion and entropy at higher temperatures by shifting interactions rather than losing them and their associated favorable enthalpic contributions.
When the temperature was raised to 100°C, a temperature at which UVF was experimentally observed to be folded (Shah et al., 2007), the core Cα RMSD (Fig. 3) and S2axis values (Fig. 7) did not change at all relative to 25°C. However, 100°C is well above the Tm of EnHD [52°C (Mayor et al., 2000)], and there was a marked increase in the average core Cα RMSD and a decrease in S2axis for EnHD relative to 25°C. Final structures from the simulations show that EnHD began to unfold at high temperature (Fig. 9) whereas UVF maintained its structure along with heightened backbone dynamics like that observed at 25°C (Fig. 8). While EnHD did not become fully unfolded at 100°C in these relatively short simulations, it did lose hydrophobic side chain contacts between the helices (Figs 5 and 6A). At high temperatures, EnHD has been experimentally observed to maintain large amounts of helical content in its denatured state (Mayor et al., 2003a). Consistent with the framework mechanism for folding, which has been observed for this protein previously (Mayor et al., 2003b; DeMarco et al., 2004), EnHD maintained its helical main chain–main chain contacts while losing hydrophobic and side chain contacts. UVF, on the other hand, had no change in the number or type of side chain contacts when the temperature was raised from 25 to 100°C (Fig. 6A).
Other proteins that have been engineered with the same intent of localizing polar residues to the surface and hydrophobic to buried regions have likewise been found to have a fluid core. α3D, for example, had similar backbone movement as natural proteins but more dynamic side chains in its core, as seen by N–H and methyl S2 order parameters (Walsh et al., 1999, 2001). This protein, though it was designed for stability, is extremely fast-folding (t1/2 ≈5 μs at 25°C), which the authors attributed to a loose transition state ensemble caused by pre-existing hydrophobic clusters, mid-range interactions in the turns, a predisposition to form helices and an imprecise arrangement of the orientation of buried side chains (Zhu et al., 2003). In agreement with these findings for α3D, kinetic studies of UVF revealed that it folded almost twice as fast as EnHD (t1/2 ≈9 and 15 μs, respectively at 25°C; Gianni et al., 2003; Gillespie et al., 2003), and unlike EnHD, UVF had a loosely packed transition state.
It has been shown previously that addition of salt bridges, especially on the protein surface, results in increased thermostability (Strickler et al., 2006). Chan et al. showed that this stabilization is due to a lower change in heat capacity (ΔCp) upon folding, with contributions of ∼0.2 kcal mol−1 K−1 per salt bridge (Chan et al., 2011). In designing UVF, eight hydrophobic surface residues on EnHD were mutated to polar residues, and five of these polar residues were charged: Leu13Glu, Ala14Glu, Tyr25Arg, Ala43Glu and Ile56Lys. Glu14 was the only one of these residues to make a salt bridge in the UVF NMR structure, but in our simulations all five residues spent most of the time making salt bridges with other polar/charged surface residues. Indeed, UVF had an increase in the number of surface hydrogen bonds (most of which were also salt bridges) over EnHD, especially at 100°C (Fig. 6B).
In an earlier study, Bolon and Mayo surveyed 263 globular proteins to determine the distribution of buried polar residues in proteins and found that ∼1/3 of buried residues were polar (Bolon and Mayo, 2001). In addition, they mutated polar residues in the core of Escherichia coli thioredoxin to hydrophobic amino acids, and a quintuple mutant was shown to have a heterogeneous, though folded, conformation under native conditions. The authors suggested that buried polar residues more uniquely specify the folded structures due to the directional nature of their interactions and hydrophobic aversion, consistent with the known specific nature of polar interactions vs. non-specific hydrophobic interactions. EnHD, in agreement with the 263 natural proteins surveyed, has 6 polar out of 16 buried residues. However, these six residues do not form hydrogen bonds with each other, but instead they interact with other polar residues on the surface of EnHD. When these six residues were mutated to hydrophobic amino acids in UVF, the resulting structure was likewise found to have a fluid core and be heterogeneous in nature. So it seems that while mutating buried polar amino acids to hydrophobic residues results in thermostabilized proteins, the effect is due to removing specific interactions between the buried and surface residues rather than among the buried polar residues themselves, creating a core stabilized by dynamic, non-specific side chain packing.
Conclusions
We have compared the dynamics of EnHD and its engineered thermostabilized variant, UVF, at 25 and 100°C. We validated our simulations against NMR observables including 3JHNHα coupling constants, backbone amide S2 order parameters, and NOEs. Our simulations suggest that UVF is able to maintain a folded structure at a higher temperature primarily due to increased flexibility in its core interactions. Although UVF was designed to maximize enthalpy upon folding, we have shown that the entropic contribution is essential for maintaining the stability of UVF at high temperature.
Funding
This work was supported by the National Institutes of Health (NIH GM50789 to V.D.) and by the Department of Defense through the National Defense Science and Engineering Graduate Fellowship Program to M.E.M. Protein images were made with UCSF Chimera.
References
- Beck D.A.C., Alonso D.O.V., Inoyama D., Daggett V. Proc. Natl Acad. Sci. USA. 2008;105:12259–12264. doi: 10.1073/pnas.0706527105. [DOI] [PMC free article] [PubMed] [Google Scholar]
- Beck D.A.C., Armen R.S., Daggett V. Biochemistry. 2005;44:609–616. doi: 10.1021/bi0486381. [DOI] [PubMed] [Google Scholar]
- Beck D.A.C., Daggett V. Methods. 2004;34:112–120. doi: 10.1016/j.ymeth.2004.03.008. [DOI] [PubMed] [Google Scholar]
- Beck D.A.C., McCully M.E., Alonso D.O.V., Daggett V. In Lucem Molecular Mechanics (ilmm) Seattle: University of Washington; 2000–2012. [Google Scholar]
- Bolon D.N., Mayo S.L. Biochemistry. 2001;40:10047–10053. doi: 10.1021/bi010427y. [DOI] [PubMed] [Google Scholar]
- Chan C.-H., Yu T.-H., Wong K.-B. PLoS One. 2011;6:e21624. doi: 10.1371/journal.pone.0021624. [DOI] [PMC free article] [PubMed] [Google Scholar]
- Clarke N.D., Kissinger C.R., Desjarlais J., Gilliland G.L., Pabo C.O. Protein Sci. 1994;3:1779–1787. doi: 10.1002/pro.5560031018. [DOI] [PMC free article] [PubMed] [Google Scholar]
- DeMarco M.L., Alonso D.O.V., Daggett V. J. Mol. Biol. 2004;341:1109–1124. doi: 10.1016/j.jmb.2004.06.074. [DOI] [PubMed] [Google Scholar]
- Doreleijers J.F., Nederveen A.J., Vranken W., Lin J., Bonvin A.M.J.J., Kaptein R., Markley J.L., Ulrich E.L. J. Biomol. NMR. 2005;32:1–12. doi: 10.1007/s10858-005-2195-0. [DOI] [PubMed] [Google Scholar]
- Gianni S., Guydosh N.R., Khan F., Caldas T.D., Mayor U., White G.W., DeMarco M.L., Daggett V., Fersht A.R. Proc. Natl Acad. Sci. USA. 2003;100:13286–13291. doi: 10.1073/pnas.1835776100. [DOI] [PMC free article] [PubMed] [Google Scholar]
- Gillespie B., Vu D.M., Shah P.S., Marshall S.A., Dyer R.B., Mayo S.L., Plaxco K.W. J. Mol. Biol. 2003;330:813–819. doi: 10.1016/s0022-2836(03)00616-8. [DOI] [PubMed] [Google Scholar]
- Karplus M. J. Chem. Phys. 1959;30:11–15. [Google Scholar]
- Kell G.S. J. Chem. Eng. Data. 1967;12:66–69. [Google Scholar]
- Levitt M. J. Mol. Biol. 1983;168:621–657. doi: 10.1016/s0022-2836(83)80306-4. [DOI] [PubMed] [Google Scholar]
- Levitt M., Hirshberg M., Sharon R., Daggett V. Comp. Phys. Comm. 1995;91:215–231. [Google Scholar]
- Levitt M., Hirshberg M., Sharon R., Laidig K.E., Daggett V. J. Phys. Chem. B. 1997;101:5051–5061. [Google Scholar]
- Lipari G., Szabo A. J. Am. Chem. Soc. 1982;104:4546–4559. [Google Scholar]
- Marshall S.A., Mayo S.L. J. Mol. Biol. 2001;305:619–631. doi: 10.1006/jmbi.2000.4319. [DOI] [PubMed] [Google Scholar]
- Marshall S.A., Morgan C.S., Mayo S.L. J. Mol. Biol. 2002;316:189–199. doi: 10.1006/jmbi.2001.5326. [DOI] [PubMed] [Google Scholar]
- Mayor U., Grossmann J.G., Foster N.W., Freund S.M., Fersht A.R. J. Mol. Biol. 2003a;333:977–991. doi: 10.1016/j.jmb.2003.08.062. [DOI] [PubMed] [Google Scholar]
- Mayor U., Guydosh N.R., Johnson C.M., et al. Nature. 2003b;421:863–867. doi: 10.1038/nature01428. [DOI] [PubMed] [Google Scholar]
- Mayor U., Johnson C.M., Daggett V., Fersht A.R. Proc. Natl Acad. Sci. USA. 2000;97:13518–13522. doi: 10.1073/pnas.250473497. [DOI] [PMC free article] [PubMed] [Google Scholar]
- McCully M.E., Beck D.A.C., Daggett V. Biochemistry. 2008;47:7079–7089. doi: 10.1021/bi800118b. [DOI] [PMC free article] [PubMed] [Google Scholar]
- McCully M.E., Beck D.A.C., Fersht A.R., Daggett V. Biophys. J. 2010;99:1628–1636. doi: 10.1016/j.bpj.2010.06.040. [DOI] [PMC free article] [PubMed] [Google Scholar]
- Pardi A., Billeter M., Wuthrich K. J. Mol. Biol. 1984;180:741–751. doi: 10.1016/0022-2836(84)90035-4. [DOI] [PubMed] [Google Scholar]
- Religa T.L. J. Biomol. NMR. 2008;40:189–202. doi: 10.1007/s10858-008-9223-9. [DOI] [PubMed] [Google Scholar]
- Shah P.S., Hom G.K., Ross S.A., Lassila J.K., Crowhurst K.A., Mayo S.L. J. Mol. Biol. 2007;372:1–6. doi: 10.1016/j.jmb.2007.06.032. [DOI] [PubMed] [Google Scholar]
- Strickler S.S., Gribenko A.V., Gribenko A.V., Keiffer T.R., Tomlinson J., Reihle T., Loladze V.V., Makhatadze G.I. Biochemistry. 2006;45:2761–2766. doi: 10.1021/bi0600143. [DOI] [PubMed] [Google Scholar]
- Walsh S.T.R., Cheng H., Bryson J.W., Roder H., DeGrado W.F. Proc. Natl. Acad. Sci. USA. 1999;96:5486–5491. doi: 10.1073/pnas.96.10.5486. [DOI] [PMC free article] [PubMed] [Google Scholar]
- Walsh S.T.R., Lee A.L., DeGrado W.F., Wand A.J. Biochemistry. 2001;40:9560–9569. doi: 10.1021/bi0105274. [DOI] [PubMed] [Google Scholar]
- Wong K.B., Daggett V. Biochemistry. 1998;37:11182–11192. doi: 10.1021/bi980552i. [DOI] [PubMed] [Google Scholar]
- Zhu Y., Alonso D.O.V., Maki K., Huang C.Y., Lahr S.J., Daggett V., Roder H., DeGrado W.F., Gai F. Proc. Natl Acad. Sci. USA. 2003;100:15486–15491. doi: 10.1073/pnas.2136623100. [DOI] [PMC free article] [PubMed] [Google Scholar]