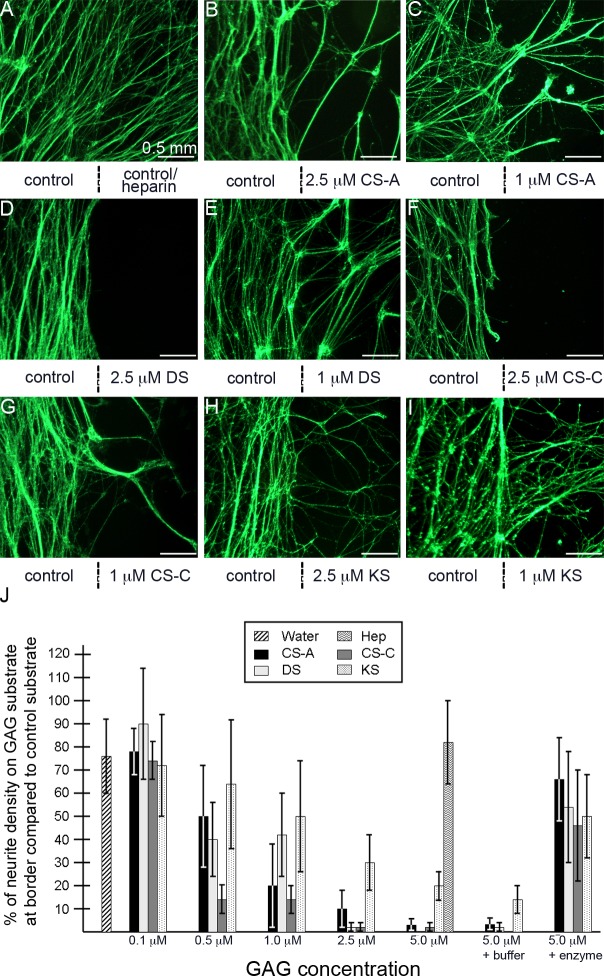
Figure 6. .
Neurite outgrowth in response to varying concentrations of GAG substrates. (A–I) High-magnification images show the areas surrounding the spot border. The strategy for generating culture substrates for trigeminal neurons that contain PDL/laminin and GAG or control spots was described in Figure 5A. A vertical line below the image indicates the location of the boundary between the PDL/laminin only substrate (control, left) and the test substrate (GAG or control spot, right). Test substrates and the molar concentration at which they were prepared are also provided below each image. Neurites encountering a GAG substrate of CSA (B, C), DS (D, E), CSC (F, G), or KS (H, I) are inhibited to different degrees, dependent on the type of GAG and concentration (1 μM vs. 2.5 μM), whereas neurites are not inhibited upon encountering a water control or heparin substrate (A). (J) Percentages of neurite density visible on test substrata for each GAG type and at various concentrations (right side of the vertical line) following 3 days of growth as compared with the neurite density visible on the control substrate (left side of the vertical line). Refer to the Methods section for further details about how the neurite density values were determined. Error bars represent SD. Scale bar, 0.5 mm.

