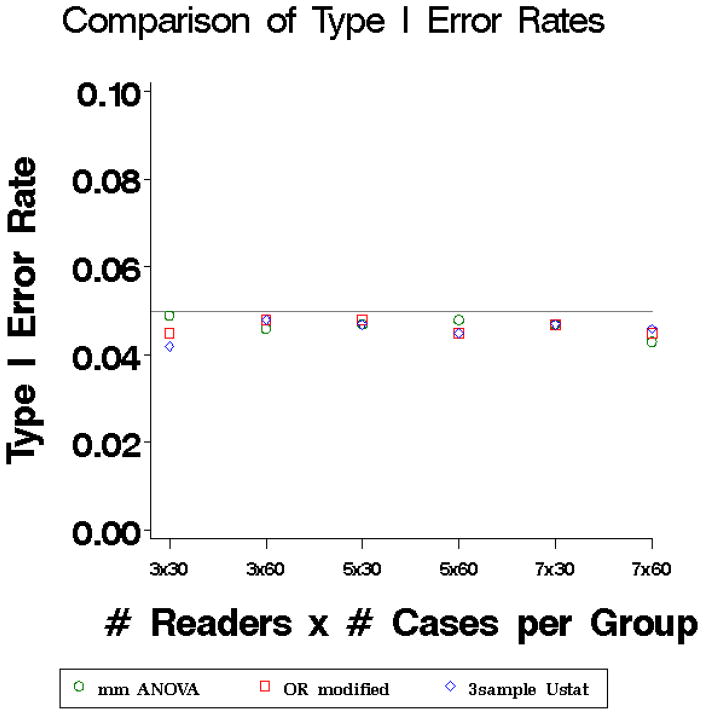
Figure 1.
Type I error rates of three methods: marginal mean ANOVA test statistic (mm ANOVA) (Equation 6) plotted with circles, modified OR test statistic (Equation 3) plotted with squares, and three-sample U-statistic (equation 10) plotted with diamonds. The nominal type I error rate was 0.05.

