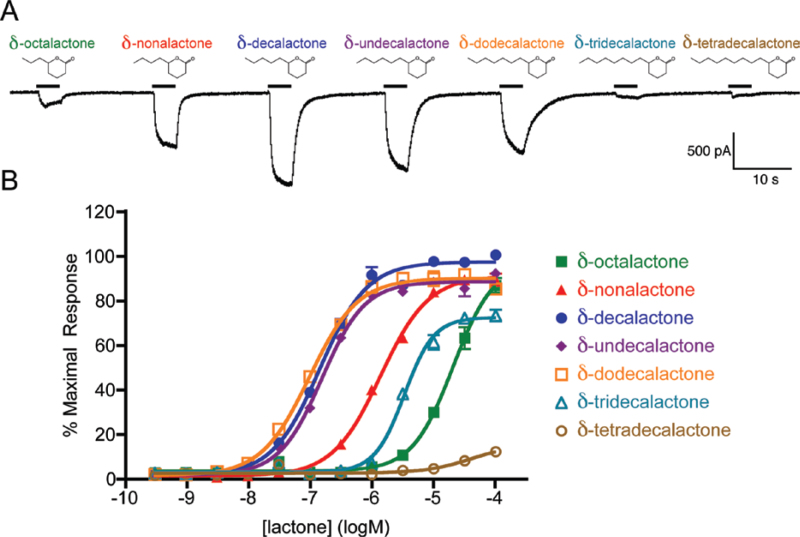
Figure 2.
Several δ-lactones gate the AgOr48 complex. (A) Current responses of an AgOr48 + AgOrco-expressing cell during application of various δ-lactones (1 µM). Holding potential is −60 mV. (B) Concentration-response curves generated from Ca++-imaging assays on AgOr48 + AgOrco cells (n = 4). Data points represent the mean ± SEM and percent maximal response is normalized to the plate standard, δ-decalactone. EC50 values from the curve fit can be found in Supplementary Table S1.

