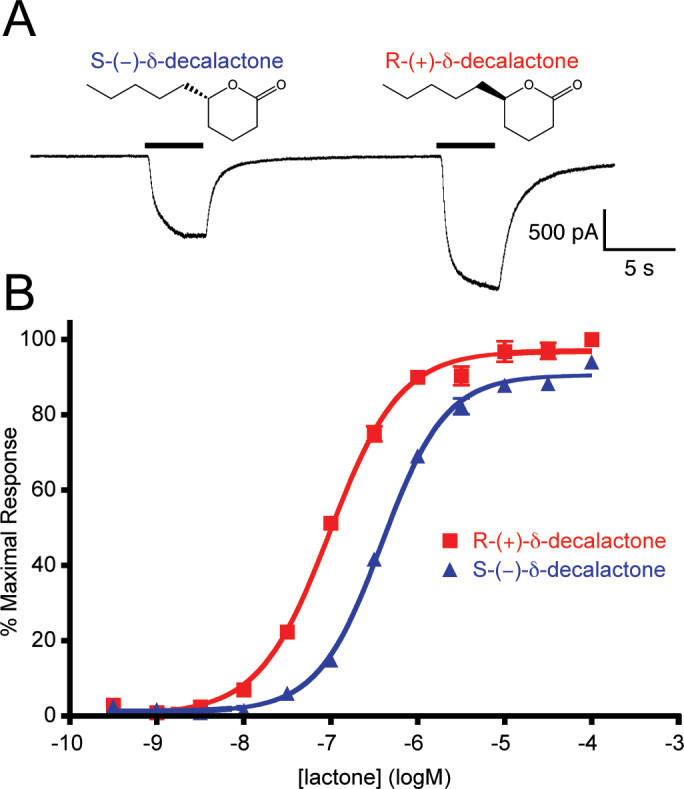
Figure 5.
Enantiomers of δ-decalactone display different agonist potencies on AgOr48 cells. (A) A current recording from an AgOr48 + AgOrco cell during a 1 µM application of S-(−)-δ-decalactone and R-(+)-δ-decalactone. Holding potential is −60 mV. (B) Concentration-response curves generated from Ca++-imaging assays on AgOr48 + AgOrco cells (n = 4). Data points represent the mean ± SEM and percent maximal response is normalized to the plate standard, δ-decalactone. The EC50 values from the curve fit differ significantly between the R- and S-enantiomers (P < 0.0001, F test) and can be found can be found in Supplementary Table S1.

