Figure 5.
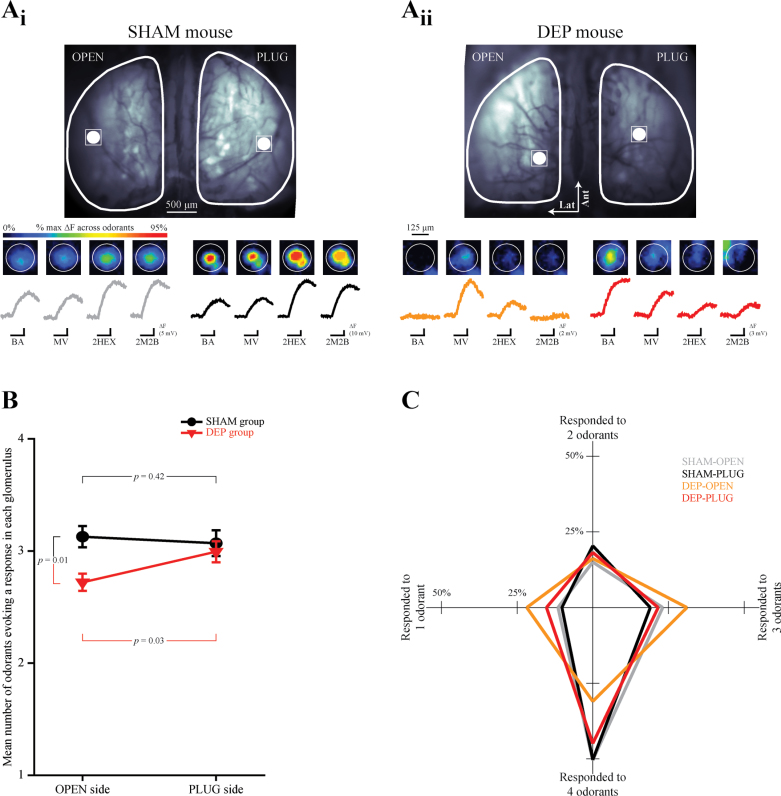
Glomerular response selectivity in the OPEN side of DEP mice is increased. (A) A single glomerulus’ location is identified on the OPEN and PLUG sides in the resting fluorescence images from SHAM (A i) and DEP (A ii) mice and magnified in the pseudocolored images which show 4 odorant-evoked responses. Black scale bars indicate the 6-s odorant presentation corresponding to each trace. Each set of 4 traces is scaled relative to the maximum evoked amplitude across odorants, as indicated by the evoked fluorescence (ΔF) scale bars for each trace set. (B) The mean (±SEM) number of odorants responded to (min = 1, max = 4) plotted as a function of side for SHAM and DEP groups. (C) The percent of glomeruli from OPEN and PLUG sides of SHAM and DEP groups which responded to 1, 2, 3, or 4 odorants. The shape of each plot represents the overall response selectivity of each population of responding glomeruli.

