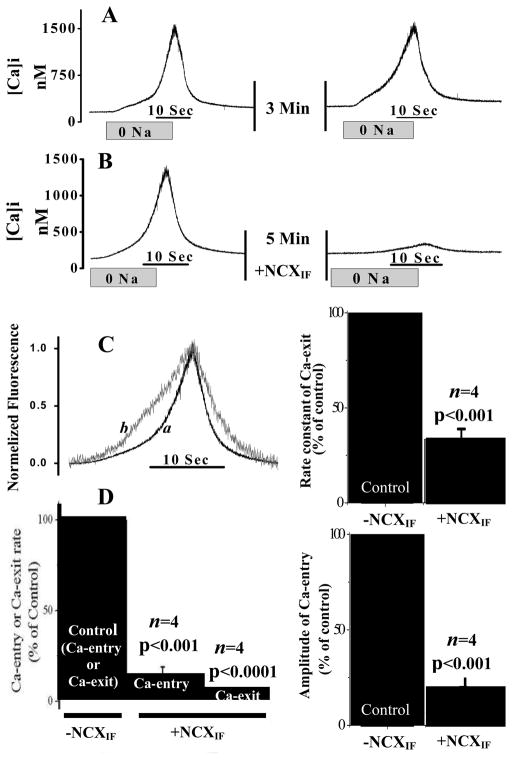
Fig. 3. NCXIF–dependent inhibition of Ca2+-entry and Ca2+-exit modes of the Na+/Ca2+ exchanger in intact cardiomyocytes.
The Ca2+-entry and Ca2+-exit modes of NCX were monitored in intact cardiomyocytes by perfusing the recording chamber with 0 mM Na+ medium for 20 seconds (abrupt-0Na). Then the chamber was perfused with normal medium, as indicated, and subsequently, the second session of the Ca2+-entry and Ca2+-exit reaction was generated in the same cardiomyocyte by switching to the 0 mM Na+ perfusion medium for 20 sec. A. Two consecutive sections of Na+-abrupt reaction in the absence of NCXIF. B. After the first abrupt-0 Na+, the recording chamber was perfused with NCXIF (50 units/ml) for 5 min and the Ca2+-entry and Ca2+-exit reactions were monitored by performing a second abrupt-0Na in the same cardiomyocyte. C. The data representing the typical effects of NCXIF on Ca-entry and Ca2+-exit modes (see panel B) were normalized. The trace-a represents the control before exposure to NCXIF, and the trace-b depicts the recordings obtained after exposure of the same cardiomyocyte to NCXIF (50 units/ml) for 5 min. The Ca2+-exit rate constant (k) was calculated from the signal obtained by abrupt Na+ removal and is presented as the percentage of the control rate constant. The control rate constant (100%) represents k = 0.24 ± 0.047 s−1. D. Maximal rates (first derivative) of each reaction are presented as the percentage of control. The control rate (100%) represents 157.1 ± 37.2 nM [Ca2+]i·s−1 for the Ca2+-entry phase and 230.7 ± 54.8 nM [Ca2+]i·s−1 for the Ca2+-exit phase. The amplitude of the Ca2+-entry mode was measured in the presence and absence of NCXIF under the conditions described in panel B. The control amplitude (100%) represents the Δ[Ca2+]i value of 865.2 ± 200.9 nM measured in the absence of NCXIF. Results are represented as the mean ± SEM. The n values represent the data collected from cardiomyocytes isolated from different animals.

