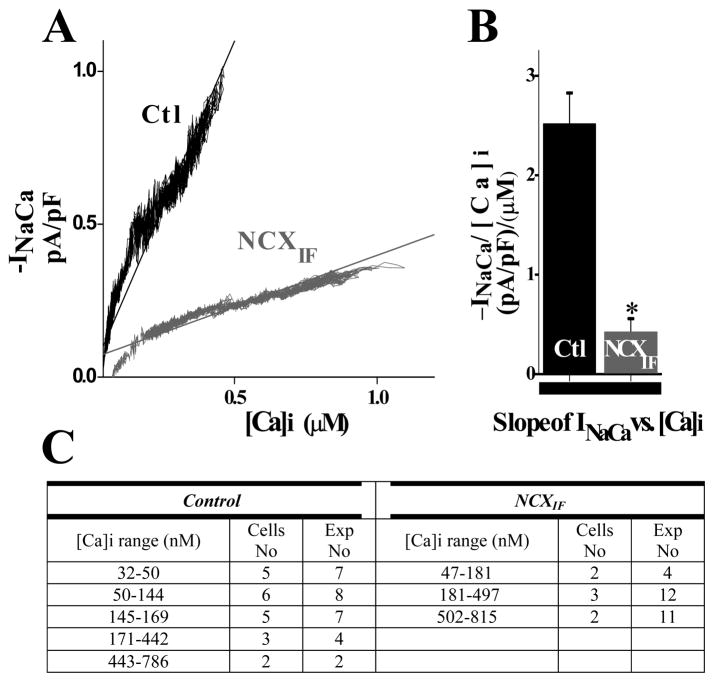
Fig. 6. Effect of directly loading NCXIF into the cytoplasm on INCX during the [Ca2+]i decline.
The caffeine-evoked INCX and [Ca2+]i were simultaneously recorded and plotted as described in Figs. 4 and 5. The data were obtained by taking the decline phase of the caffeine-induced Ca2+ transient (starting from the INCX peak until the baseline was reached). A. The average INCX values (for given [Ca2+]i levels) were plotted for NCXIF-loaded or control cardiomyocytes (-NCXIF). B. The INCX/[Ca2+]i curves were fitted by linear regression and the obtained slopes were averaged as indicated (n = 9 for control cells and n = 12 NCXIF-loaded cells, P < 0.001). The n values represent the number of independent experiments. C. The observed ranges of [Ca2+]i values (obtained in each specific experiment) were plotted vs. INCX, as described in Fig. 5.

