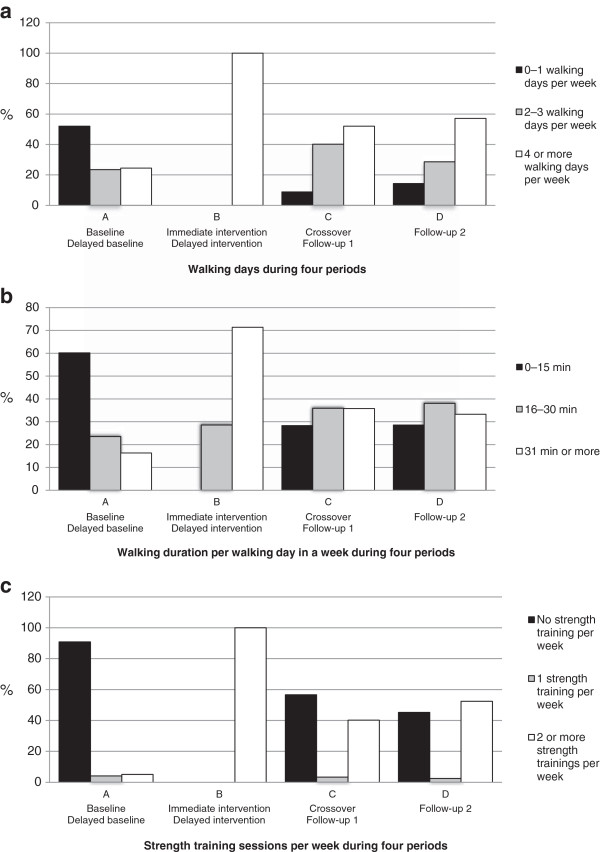
Figure 3.
a Distribution of participation spent in physical activity, walking days in a week (%), during following four periods for both groups: During the period before baseline and delayed baseline (A), during immediate intervention and delayed intervention (B), during crossover and follow-up 1 (C) and during follow-up 2 by Group 1 (D).3b Distribution of participation spent in physical activity, walking duration per walking day in a week (%), during following four periods for both groups: During the period before baseline and delayed baseline (A), during immediate intervention and delayed intervention (B), during crossover and follow-up 1 (C) and during follow-up 2 by Group 1 (D). 3c Distribution of participation spent in physical activity, strength training sessions per week (%), during following four periods for both groups: During the period before baseline and delayed baseline (A), during immediate intervention and delayed intervention (B), during crossover and follow-up 1 (C) and during follow-up 2 by Group 1 (D).

