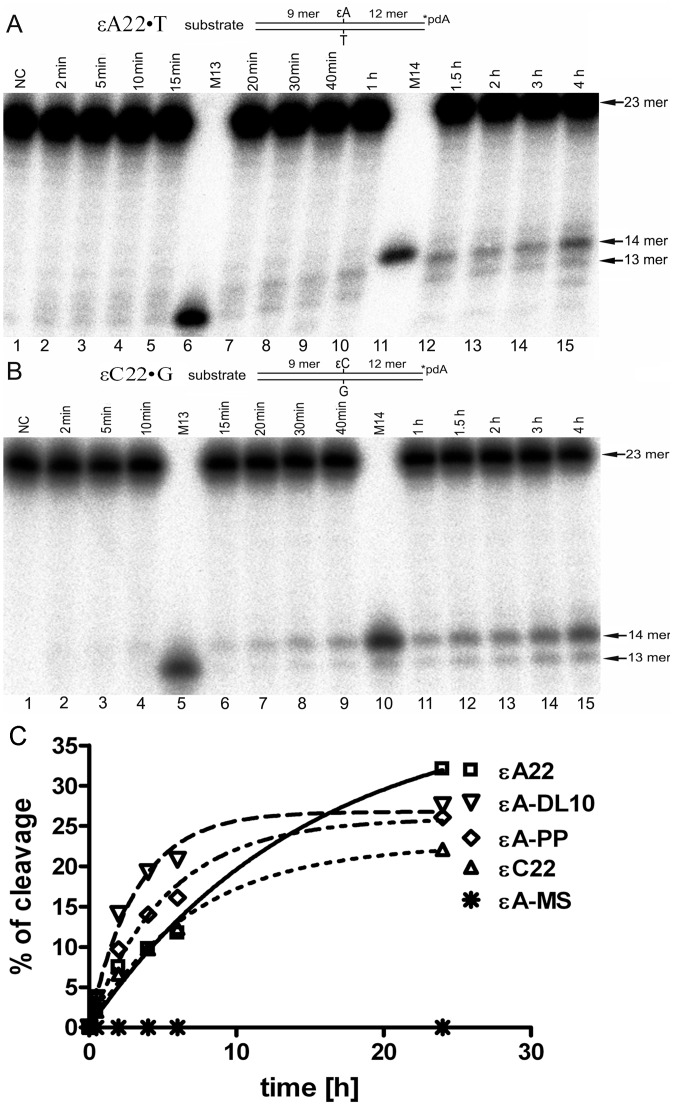
Figure 2. Time dependent cleavage of the oligonucleotide duplexes containing a single ε-base by APE1.
A solution of 10 nM of the 3′-[32P]-labelled oligonucleotide duplexes was incubated with 5 nM (A,B) or 10 nM (C) APE1 for varying periods of time at 37°C. (A) εA22•T duplex. Lane 1, control, non-treated duplex; lanes 2–5, 7–10 and 12–15, as 1 but incubated with APE1 from 2 min to 4 h; lane 6, 13 mer size marker; lane 11, 14 mer size marker. (B) εC22•G duplex. Lane 1, control, non-treated duplex; lanes 2–4, 6–9 and 11–15, as 1 but incubated with APE1 from 2 min to 4 h; lane 5, 13 mer size marker; lane 10, 14 mer size marker. The arrows denote the position of the 23-mer, 13-mer and 14-mer fragments, respectively. (C) Graphical representation of time dependent kinetics of APE1-catalyzed cleavage activity of various oligonucleotide duplexes containing either single εA or εC residue. A solution of 10 nM of the 3′-[32P]-labelled oligonucleotide duplex was incubated with 10 nM APE1 for varying periods of time at 37°C. The amount of cleavage product was quantified and plotted against incubation time. For details see Materials and Methods.

