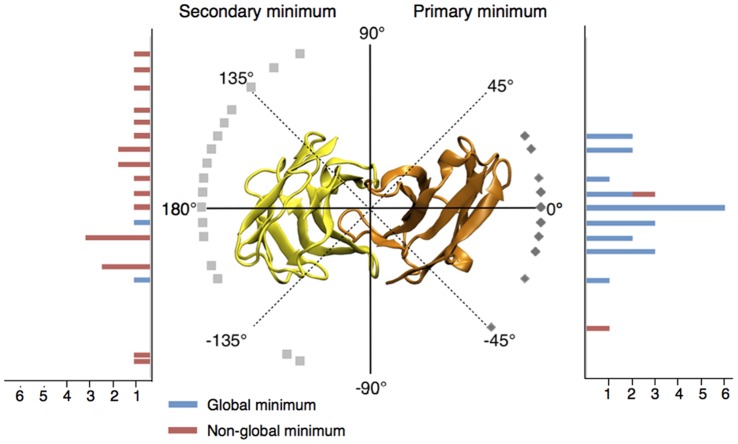
Figure 3. Summary of the repartition of primary and secondary minima in TCR rotation profiles.
0° corresponds to the native orientation of each bound conformation. The positions of the primary minima are shown on the right half of the circle and reported on the right side histogram, which indicates the number of occurrences of each minimum in the test set. Secondary minima are similarly shown on the left half of the figure. The color code of histograms discriminates between global (blue) and non-global (red) minima. Outliers are not displayed.

