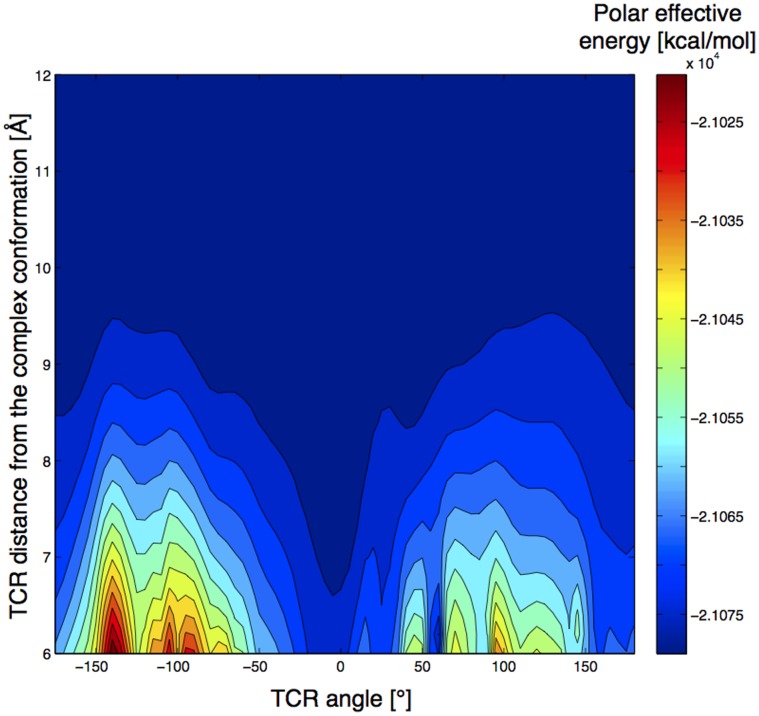
Figure 4. Landscape representation of the evolution of TCR polar energy rotation profiles of 1ao7 as a function of the TCR/pMHC distance.
The energetic preference for the native orientation (0°) is clearly visible. Rotation profiles were not computed at distances lower than 6Å due to the numerous steric clashes below that distance.

