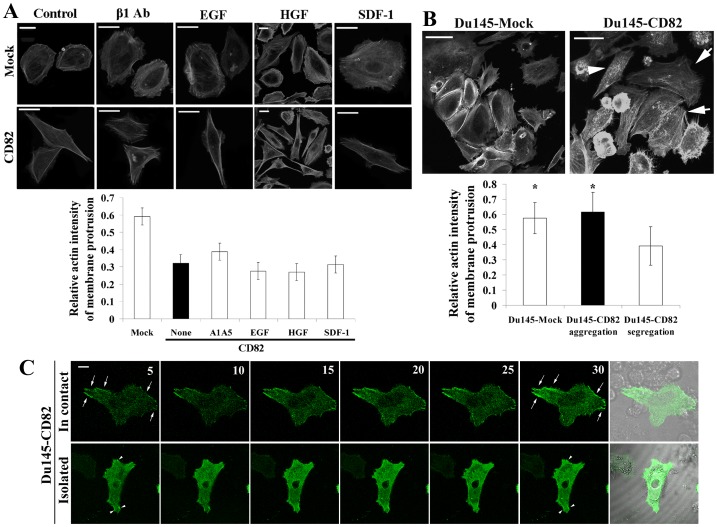
Figure 4. Regulation of KAI1/CD82-induced actin cytoskeletal changes.
( A ) Effects of integrin, growth factor, and chemokine on KAI1/CD82-induced actin cytoskeletal changes. Du145-Mock or -KAI1/CD82 transfectant cells were spread on FN-coated plates in complete DMEM and treated with integrin β1 activating mAb A1A5 (8 µg/ml), EGF (100 ng/ml), HGF (100 ng/ml), or SDF-1 (100 ng/ml) at 37°C from 4 to 6 h. Cells were then fixed, permeabilized, and incubated with Texas Red-conjugated α-phalloidin. Digital images were captured under a fluorescent microscope. Scale bar, 20 µm. Quantitative analysis (bottom panel): the cortical F-actin intensity was quantitated as described in Experimental Procedures. Bars denote the average intensity of three individual experiments. In each group, 50∼95 cells were quantified. The differences between Mock and all CD82 groups are statistically significant (P<0.05), while the differences between untreated CD82 and each treated CD82 group are not statistically significant (P>0.05). (B) Effect of the confluent cell culture on KAI1/CD82-induced actin cytoskeletal changes. Actin polymerization was analyzed in the Du145-Mock and -KAI1/CD82 cells cultured in complete DMEM at confluent stage. Scale bars, 100 µm in Du145-Mock cells and 50 µm in Du145-CD82 cells. Arrows indicate the well-developed actin cortical meshwork seen in the KAI1/CD82-expressing cells with cell-cell contacts. Arrowheads indicate that no well-developed cortical network was found in KAI1/CD82-expressing cells without cell-cell contacts. Quantitative analysis (bottom panel): the cortical F-actin intensity was quantitated as described in Experimental Procedures. Bars denote the average intensity of 32–40 cells from three individual experiments. The differences between the Mock and KAI1/CD82 cells without cell-cell contacts and between the KAI1/CD82 cells with and without cell-cell contacts are statistically significant (P<0.05), while the differences between the groups of Mock and KAI1/CD82 cells containing cell-cell contacts are not statistically significant (P>0.05). (C) The effect of cell-cell contacts on actin polymerization in Du145-KAI1/CD82 cells. Du145-KAI1/CD82 cells expressing EGFP-actin were photographed using time-lapse confocal and DIC videomicroscopy. For each group, a DIC image is included to display whether the green fluorescent cell is in cell-cell contact. Arrows and arrowheads indicate actin polymerization during the development of peripheral actin fiber. Scale bar: 10 µm.

