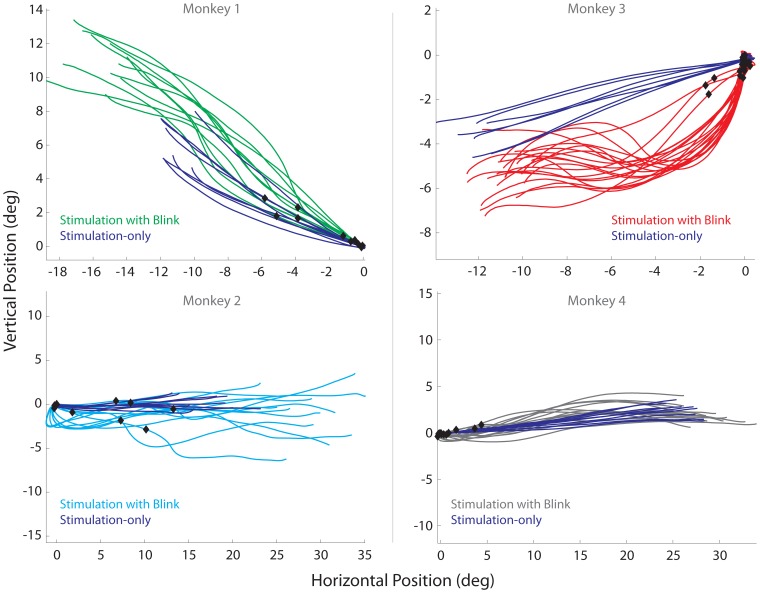
Figure 2. Microstimulation with blink examples.
Representative examples of spatial trajectories (horizontal vs. vertical eye positions) shown from the four animals evoked by sub-optimal microstimulation. In all plots, the blue trajectories represent stimulation-evoked reduced amplitude saccades without blinks. Note: mean metrics (horizontal, vertical) evoked by suprathreshold stimulation for monkey 1 (−20.6, 8.5), monkey 2 (29.9, 0), monkey 3 (−23.2, −4.5), monkey 4 (34.8, 5.3). The traces in the other colors represent movements evoked when stimulation was combined with a puff-evoked blink. All traces are offset to the origin with each trace being plotted from stimulation onset to movement offset. Note: Black diamonds superimposed on the trajectories indicate where the blink occurred relative to stimulation onset.

