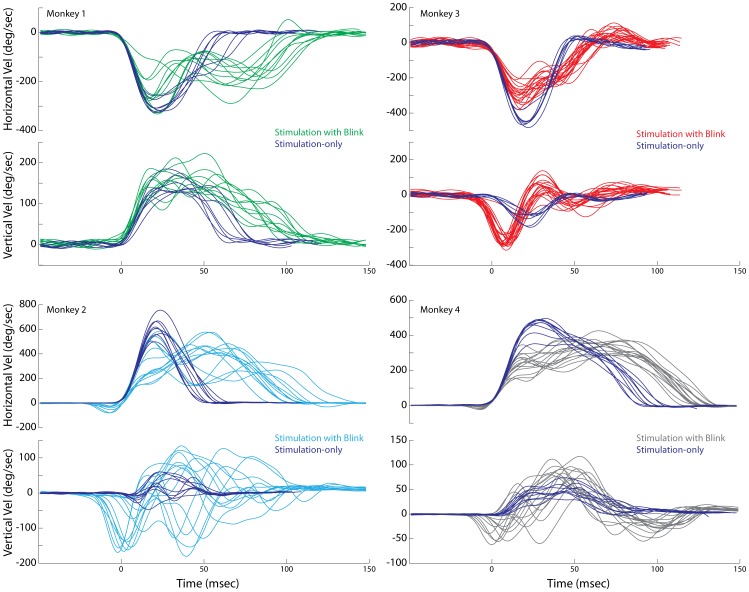
Figure 3. Temporal waveforms.
An alternate representation of the data illustrated in Figure 2. Horizontal and vertical eye velocity is plotted as a function of time for stimulation-evoked saccades with and without blink perturbations. All traces are aligned on saccade onset. All other configurations are the same as in Figure 2.

