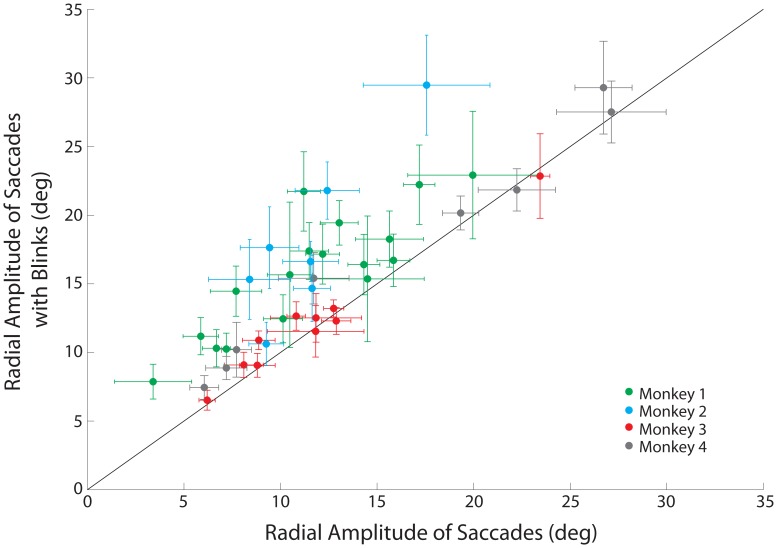
Figure 5. Comparison of radial amplitude.
Comparison of mean radial amplitudes for stimulation-evoked saccades without and with a puff-evoked blink. Green dots represent values from monkey 1; cyan, monkey 2; red, monkey 3; gray, monkey 4. Error bars represent one standard deviation from the mean; solid line marks unity slope. The majority of stimulation sites lie above the unity line, indicating an increase of saccade amplitude due to the blink-saccade interaction.

