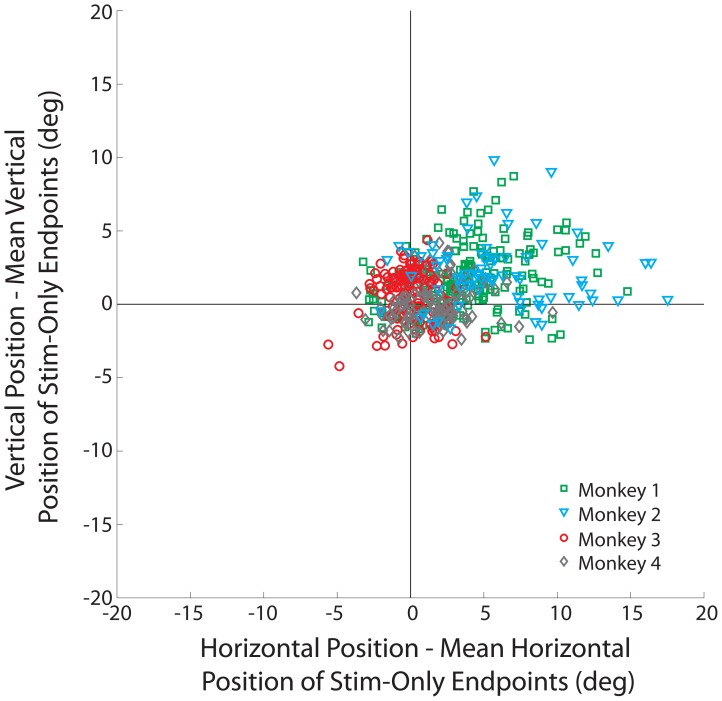
Figure 6. Distribution of dysmetria induced by the blink perturbation.
Each point represents the horizontal and vertical endpoint position of a stimulation-with-blink movement after subtraction of the endpoint of the mean stimulation-only movement obtained from the same stimulation site. Each dot represents one trial, and data from all trials across all stimulation sites are included in the plot. Green squares represent data for monkey 1; cyan triangles, monkey 2; red circles, monkey 3; gray diamonds, monkey 4. Note that the absolute values of endpoints were used to standardize alignment for movements in opposing directions.

