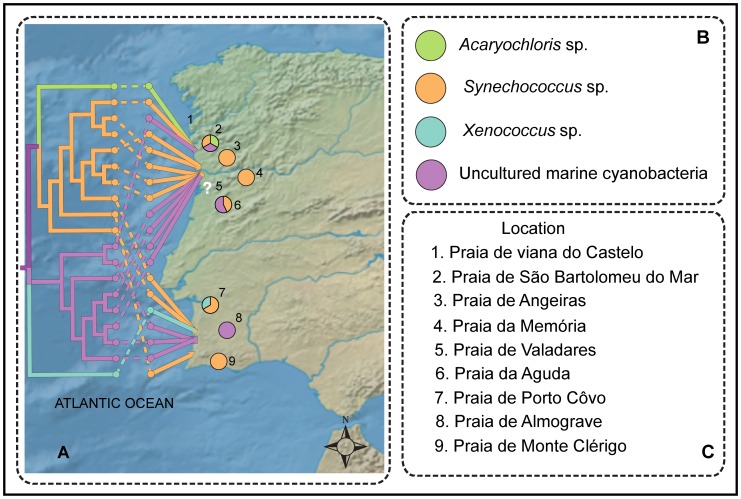
Figure 5. Geophylogeny of H. perlevis and the cyanobionts.
(A) Neighbor-joining tree using 16S rRNA gene of symbiotic cyanobacteria merged with geographical data. Evolutionary distances were calculated using p-distance. Leaf node color represents associated symbionts connected with the geographical line through respective dashed correlation line. Pie chart represents the frequency of symbionts from each location. White question mark denotes the locations where sponge associated cyanobacteria could not be identified. (B) The color representation for each symbiont. (C) Location number used in map and respective site.

