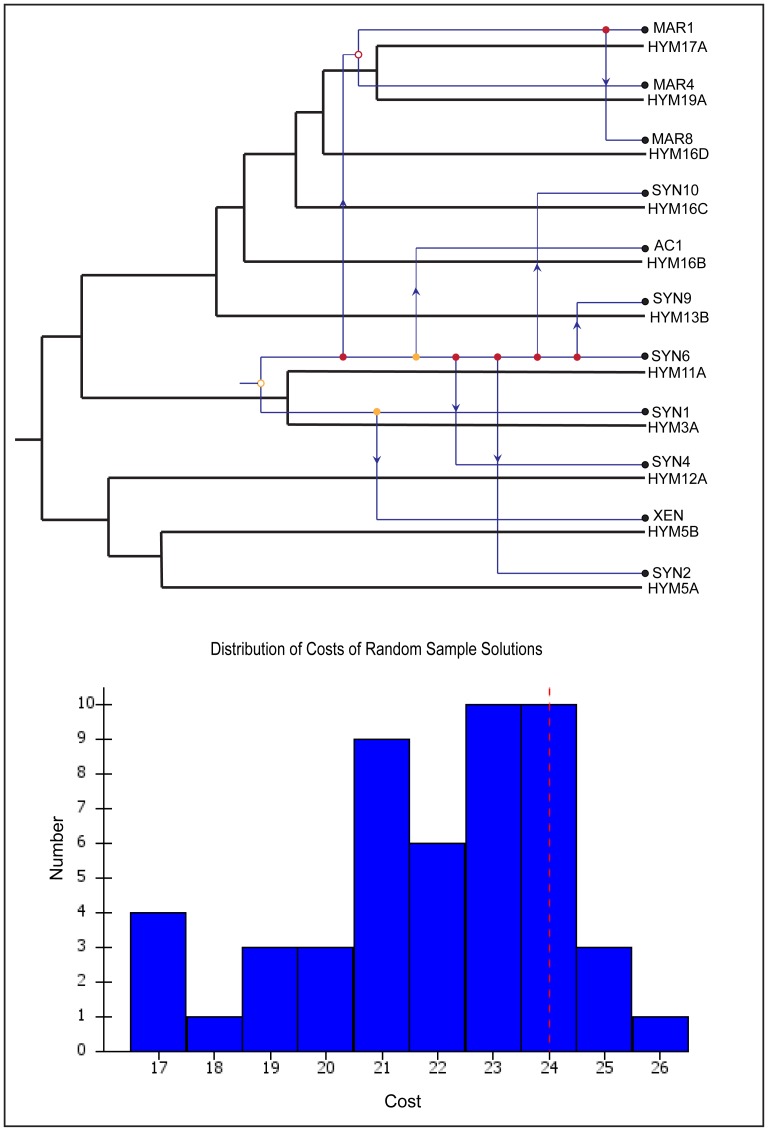
Figure 7. Coevolution and host switch between sponge host and its cyanobacterial symbionts.
Host and symbiont tree are represented by black and blue mapped each other. Hollow dots depict coevolution, thick dots as duplication and arrow for host switch. The color orange and red of the node shows good and worst placement of the events. Uncultured marine cyanobacteria – MAR1, MAR4, MAR8; Synechococcus sp.- SYN1, SYN2, SYN4, SYN6, SYN9, SYN10; Xenococcus sp.- XEN; Acaryochloris sp.-AC1. Lower panel - histogram showing 30 random samples. Red line indicates original host-symbiont mapping and blue bars indicating random mapping.

