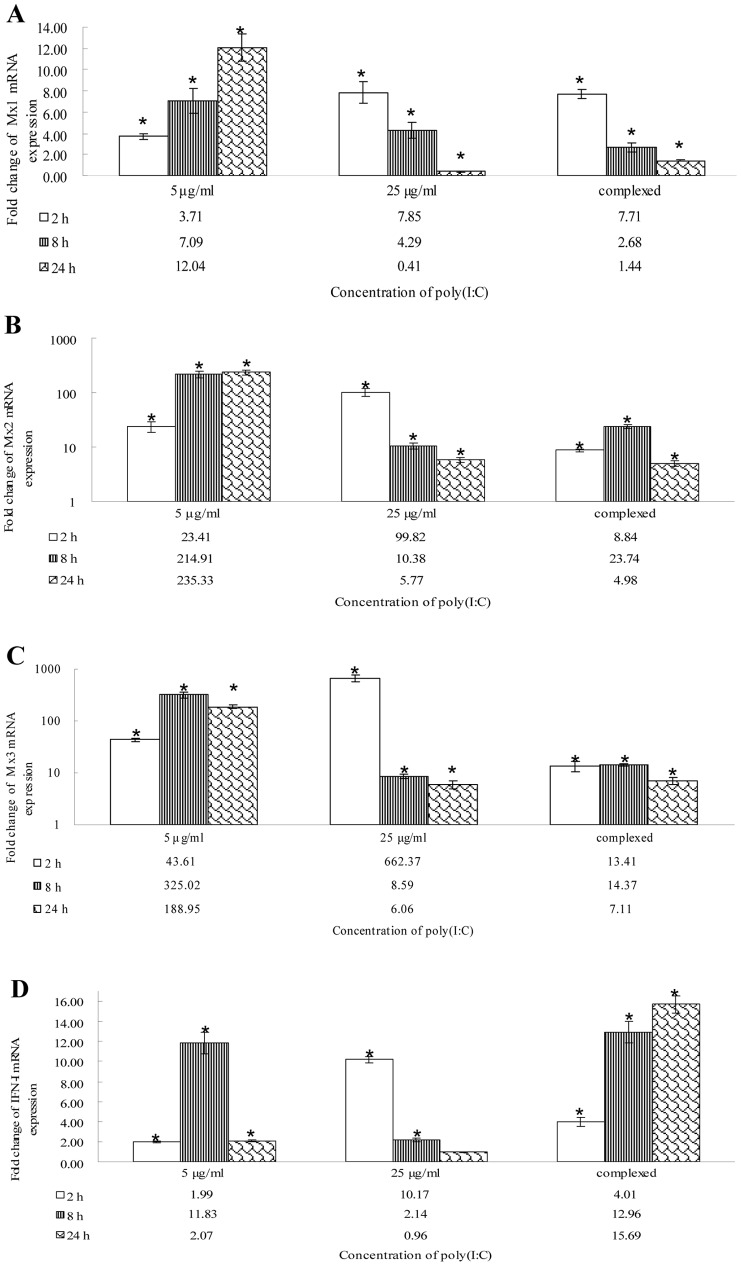
Figure 7. mRNA expression patterns of three grass carp Mx isoforms and IFN-I gene post poly(I:C) stimulation in CIK cells.
EF1α was utilized as an internal control gene. The gene expression levels were measured at 2, 8 and 24 h post-stimulation. A: Mx1 transcription; B: Mx2 transcription; C: Mx3 transcription; D: IFN-I transcription. Asterisks (*) mark the significant difference between experimental and control groups (P<0.05). Error bars indicate standard error.

