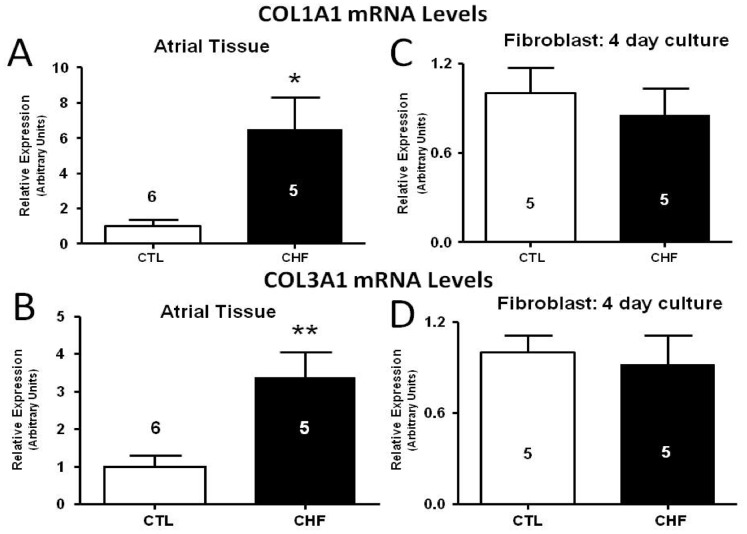
Figure 1. Gene expression of collagen I (COL1A1; top) and collagen III (COL3A1; bottom) in intact atrial tissue samples and in 4 day cultured atrial fibroblasts as measured by qPCR.
(A) COL1A1 mRNA levels in atrial tissue. (B) COL3A1 mRNA levels in atrial tissue. (C) COL1A1 mRNA levels in atrial fibroblasts after culture. (D) COL1A1 mRNA levels in atrial fibroblasts after culture. **P<0.01, *P<0.05 by t-test, number of dogs indicated in figure.

