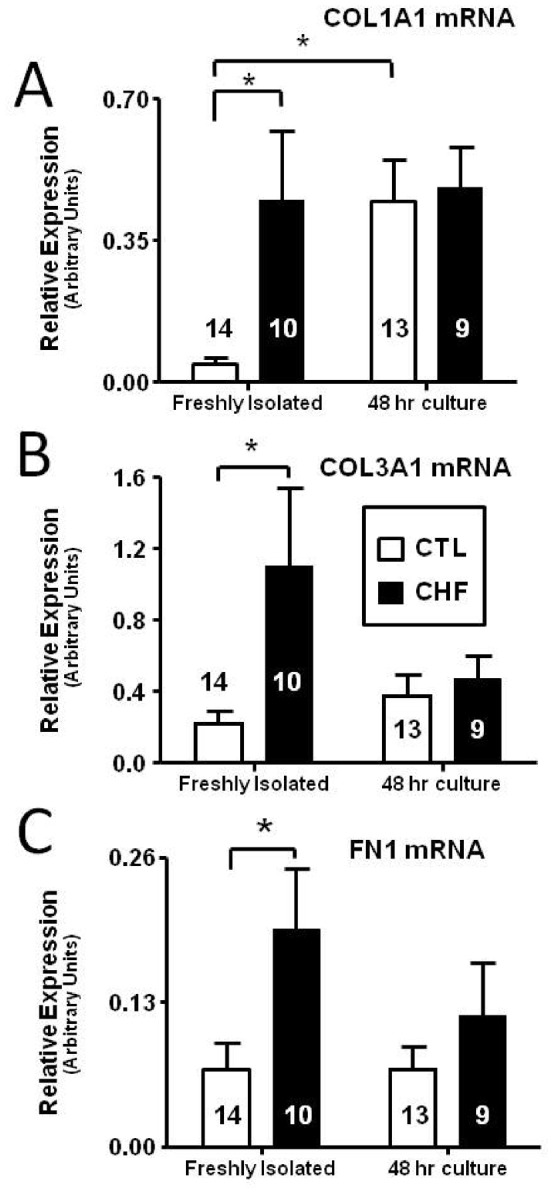
Figure 3. Comparative gene expression studies with freshly isolated versus cultured control (CTL) and CHF dog fibroblasts.

(A) COL1A1 (B) COL3A1 (C) Fibronectin (FN1) mRNA expression in freshly isolated CTL and CHF dog fibroblasts and after 48 hour culture. *P<0.05 by ANOVA with Bonferroni post-hoc tests, number of dogs indicated in figure.
