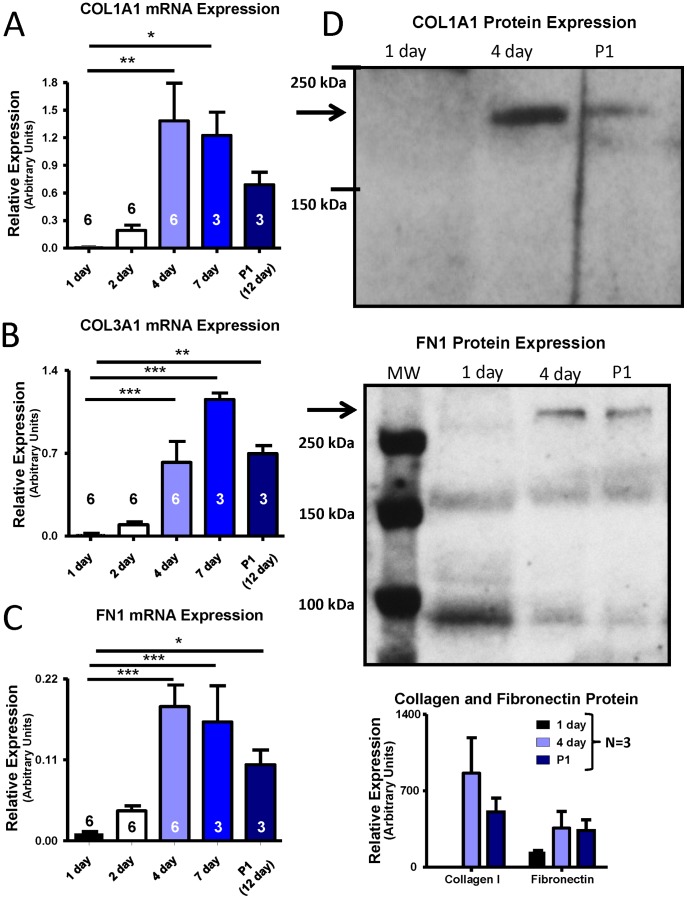
Figure 4. Dependence of fibroblast expression of various ECM proteins on time in culture. Results are shown for (A) COL1A1 mRNA, (B) COL3A1 mRNA, (C) FN1 mRNA, (D) COL1A1 and FN1 protein.
Control fibroblasts were cultured for 1, 2, 4, 7, and 12 days. For the last time point, cells were passaged (P1) after 7 days of culture and then grown to confluence (∼5 days). Representative Western blot images for COL1A1 and FN1 are shown in the upper panels of (D), with mean±SEM data beneath. Protein levels were measured from culture supernatant for the 24 hours preceding cell collection. *P<0.05, **P<0.01, ***P<0.001 by ANOVA with Bonferroni post-hoc tests, number of dogs indicated in figure.

