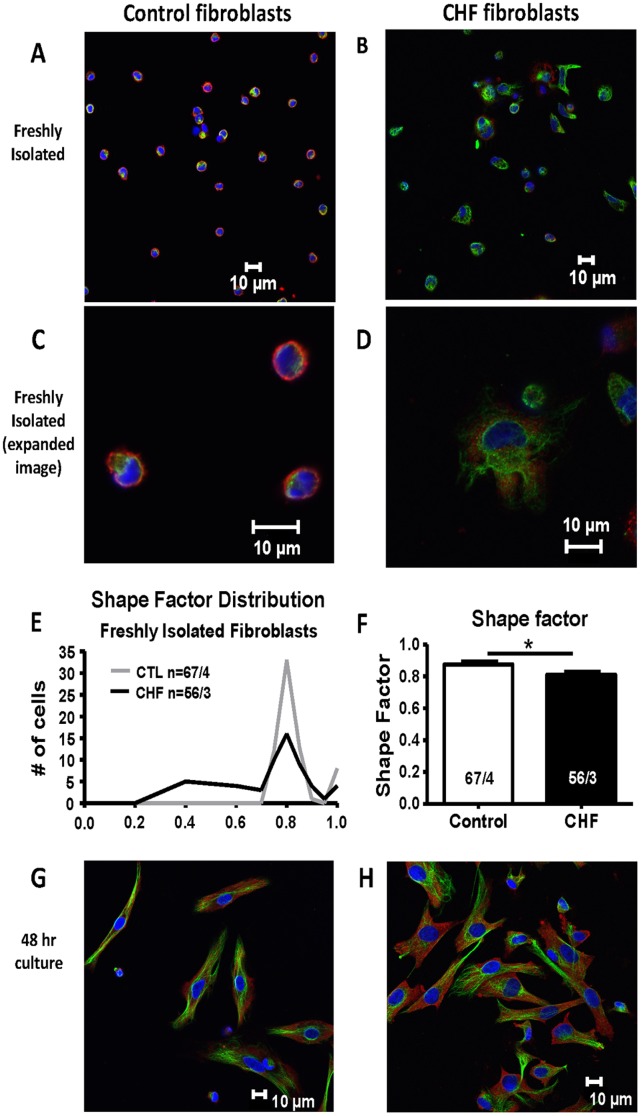
Figure 5. Immunofluorescent images of freshly isolated and cultured fibroblasts.
(A) Freshly isolated control (CTL) dog and (B) freshly isolated CHF dog fibroblasts. Expanded images of freshly isolated CTL and CHF fibroblasts are shown in (C) and (D) respectively. Staining shown is DAPI (blue, nuclear), vimentin (green, stress fibers), and α-SMA (red). Shape factor was used to quantify cell spreading in freshly isolated fibroblasts and the distribution is shown in (E). The average shape factor for both CHF and CTL is shown in (F). *P<0.05 by t-test. N/N = Number of cells/number of dogs. (G) and (H), CTL dog (G) and CHF dog (H) fibroblasts after 48 hrs of culture.

