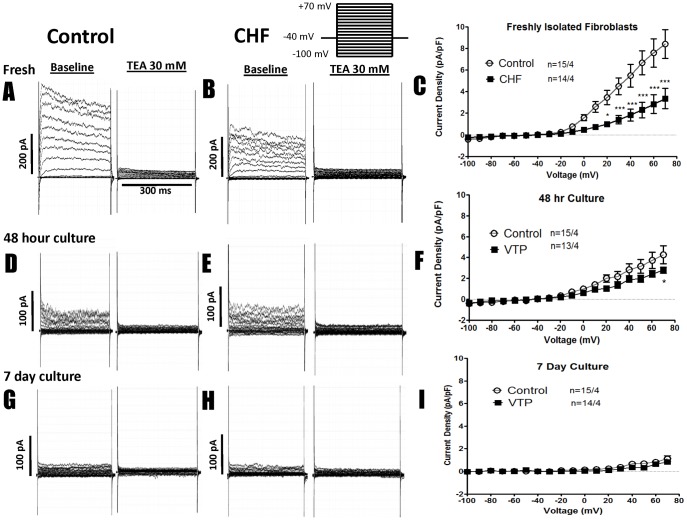
Figure 6. Representative recordings of K+-current at baseline and after TEA treatment, along with TEA-sensitive K+-current-voltage relations for control and CHF fibroblasts.
Results are shown for freshly isolated fibroblasts (top), 48-hour cultured cells (middle) and 7-day cultured cells (bottom). Each set of data shows currents before and after TEA in representative fibroblasts from a control and a CHF dog, followed by mean current-voltage relations. (A,D,G) Recordings from CTL fibroblasts freshly isolated, after 48 hr culture, and after 7 day culture at baseline and after 30 mM TEA. (B,E,H) Recordings from CHF fibroblasts freshly isolated, after 48 hr culture, and after 7 day culture. (C,F,I) The current voltage relationship for control and CHF fibroblasts that were freshly isolated (C), cultured for 48 hours (F), and after culture for 7 days (I). ***P<0.001, *P<0.05 by 2-way ANOVA followed by Bonferroni post-tests. Number of cells studied is indicated first, followed by the number of dogs.

