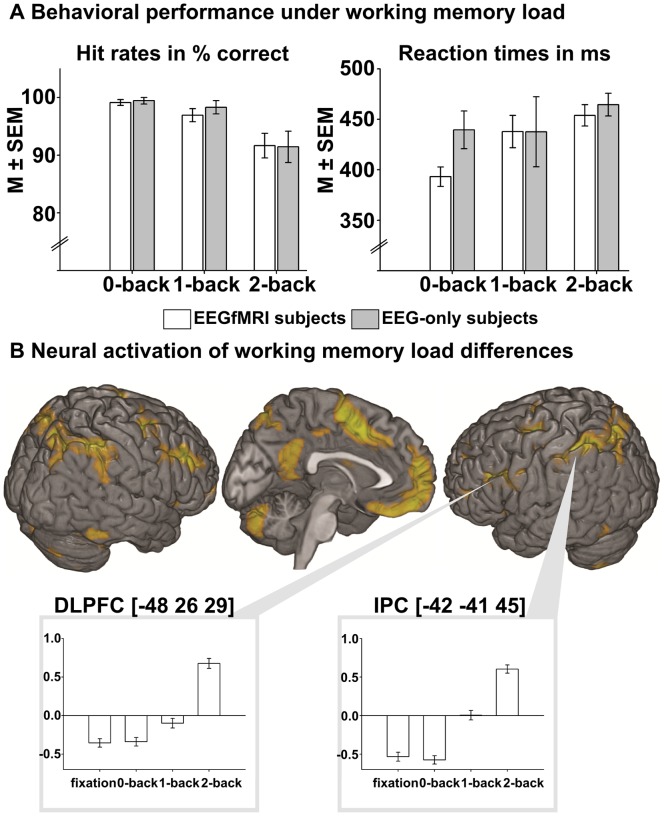
Figure 2. A) Behavioral results of WM-load manipulation on subjects' hit rates (correct %) and reaction times (both M±SEM).
In EEGfMRI subjects (n = 15) GLMs confirmed a significant increase in RTs and decrease in hit rates when WM-load increased. This was replicated in EEG-only subjects (n = 5), but only significant for hit rates. B: Neural activation of visual WM-load, displayed by a contrasts from a random-effects GLM testing for general unsigned differences between visual WM load conditions (F-contrast, F>14.46, p<.05, FWE-corrected, k>20). Within the left dorsolateral prefrontal cortex (DLPFC) and the left inferior parietal cortex (IPC), cluster mean voxel activation (±SEM) were displayed via bar charts. MNI coordinates indicate the location of the maximum within the respective cluster.

