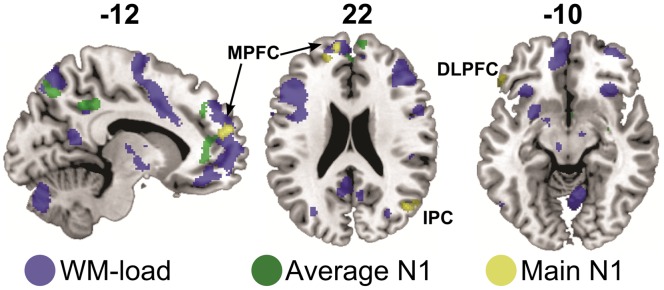
Figure 4. Sagittal and axial slices displaying overlap of inter-subject variations in N1 peak values explaining BOLD variance with frontal core WM regions.
Activation patterns resulted from a random-effects GLM including condition-wise N1 peak values for each participant as covariates, inclusively masked (p<.05 uncorrected) with the effects of interest of the HRF regressors. Green indicates the average effect of the AEP amplitudes (F>6.48, p<.05, MC-corrected), yellow indicates the main effect of AEP amplitudes, accounting for the cross-modal visual WM-condition (T>3.29, p<.05, MC-corrected). Both contrasts are overlaid on background blue coloring indicating the main n-back effect shown in Figure 3. DLPFC = dorsolateral prefrontal cortex, MPG = medial prefrontal gyrus, IPC = inferior parietal cortex.

