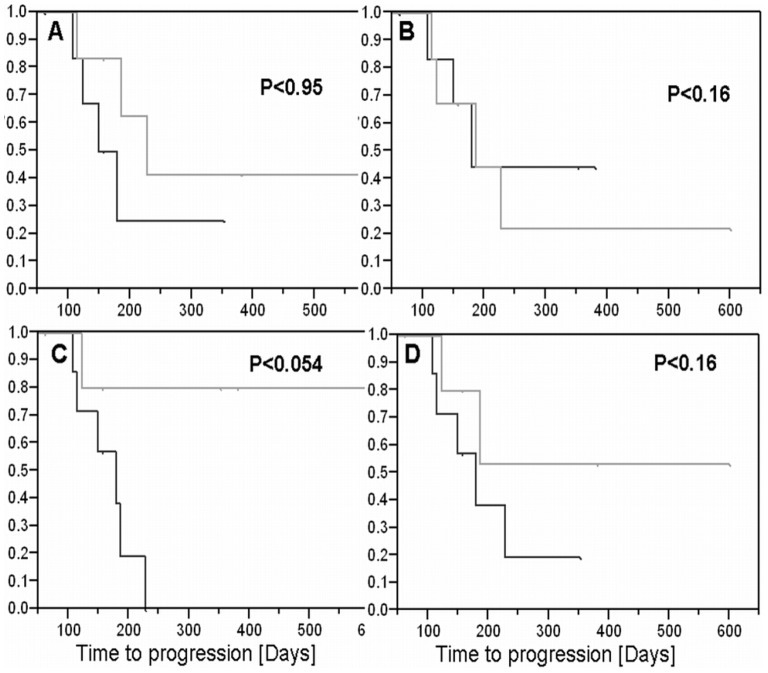
Figure 8. Correlation with time to progression.
The correlation between the late enhancement subtraction maps and time to progression was studied in a small cohort of 13 GBM patients post chemoradiation. Kaplan-Meier curves of time to progression in patients above and below the median of four predictors are shown: Initial fast volume (A), initial enhanced volume (B), initial fast growth rate (C) and initial enhanced growth rate (D). The curves are plotted for each predictor for patients above (black) and below (gray) the median. It can be seen that the initial fast growth rate predictor provides a near-significant difference between the two groups of patients, suggesting this predictor may be a candidate for prediction of time to progression.

