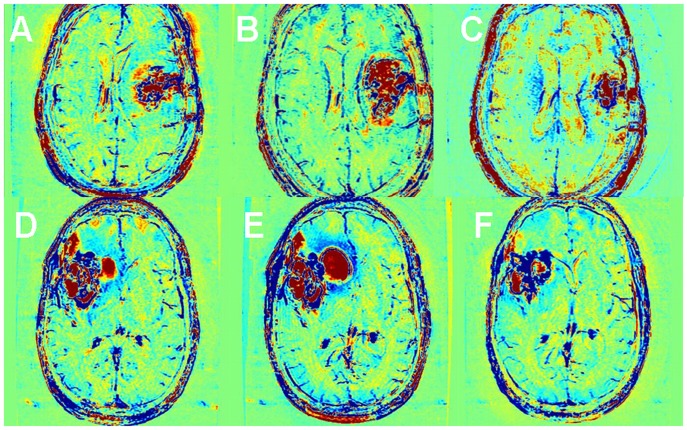
Figure 9. Examples of progression and pseudoprogression in GBM patients post chemoradiation.
Late enhancement subtraction maps of a patient (#6) with significant increase in the enhancing lesion due to increase in the red volume (A–C) and a patient (#3) with significant increase in the blue component (D–F) with minor changes in the enhancing volume are shown. In the first example, the total enhancing volume has increased by 34% from 3 weeks (A) to 4.2 months (B) post chemoradiation, and then decreased to 33% below the initial volume (C) 9 months post treatment. The blue volume slightly increased by 6% in the first 4 months (A, B) and then significantly decreased to 47% below the initial volume at 9 months (C) while the red volume increased by 51% in the first 4.2 months (A, B) and decreased to 13% above the initial volume by 9 months (C). This patient progressed 11.6 months post treatment. In the second example, the total enhancing volume has increased by 16% from 3 weeks (D) to 2.5 months (E) and then remained 17% above the initial volume (F) 6.5 months post treatment. The blue volume slightly increased by 2% in the first 2.5 months (D,E) and then significantly increased to 57% above the initial volume at 6.5 months (F) while the red volume increased by 39% in the first 2.5 months (D, E) and decreased to 61% below the initial volume by 6.5 months (F). This patient progressed 6.5 months post treatment when he was referred to surgery.

