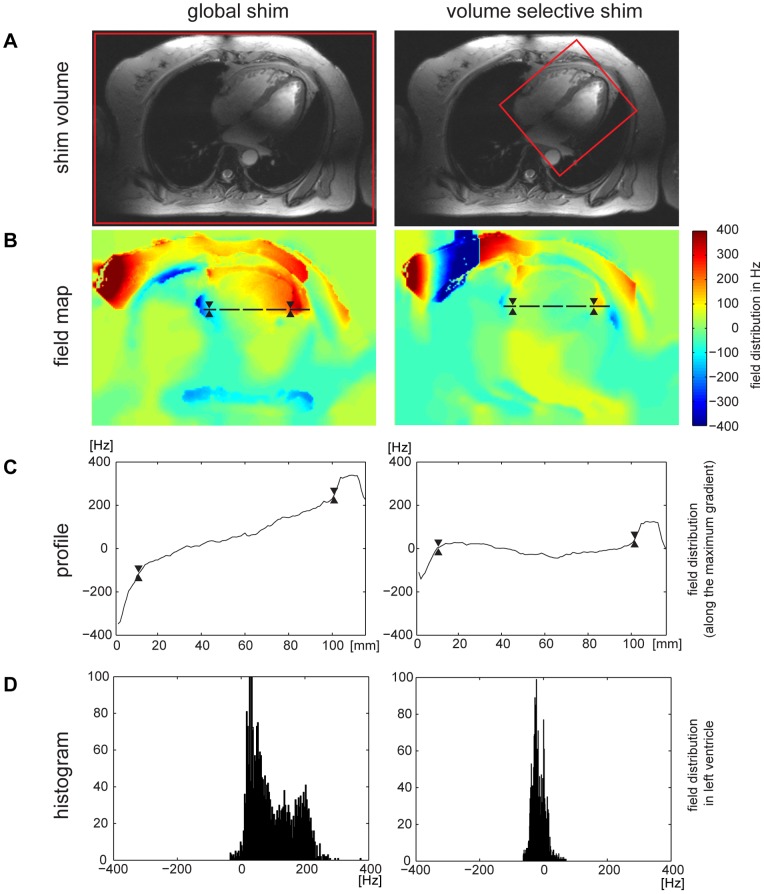
Figure 3. B0 distribution for global and volume selective B0 shimming of a four chamber view of the heart.
A) Four chamber view of the heart illustrating the positioning of the volume (marked in red) used for global (left) and volume selective (right) shimming. B) B0 field variation derived from global and volume selective shimming. For this subject the global shim provided a peak-to-peak field variation of about 400 Hz across the entire heart. After volume selective shimming peak-to-peak B0 variation across the heart was reduced to approximately 80 Hz. The direction of the maximal B0 gradient is illustrated by the dashed black line in B) and the corresponding profile of B0 field distribution is plotted in C). To guide the eye the epicardial borders are marked in B) and C) by two triangles. The histogram of the field distribution over the left ventricle is shown in D). The full width at half maximum is approximately 200 Hz for the globally shimmed B0 field map and was reduced to about 80 Hz after volume selective shimming.

