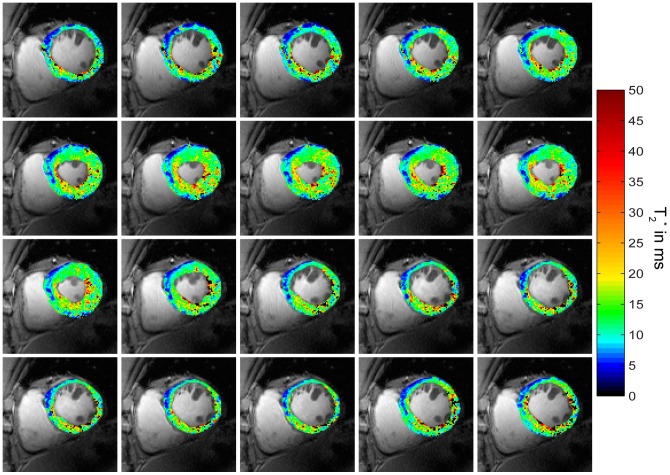
Figure 7. CINE T2 * maps over the cardiac cycle.
Short axis view T2 * colour maps derived from MB CINE acquisitions across the cardiac cycle overlaid to conventional 2D CINE FLASH images. T2 * values are increasing from diastole to systole, especially for endocardial layers. Macroscopic susceptibility induced T2 * reduction effects were present at the epicardium at inferior regions.

