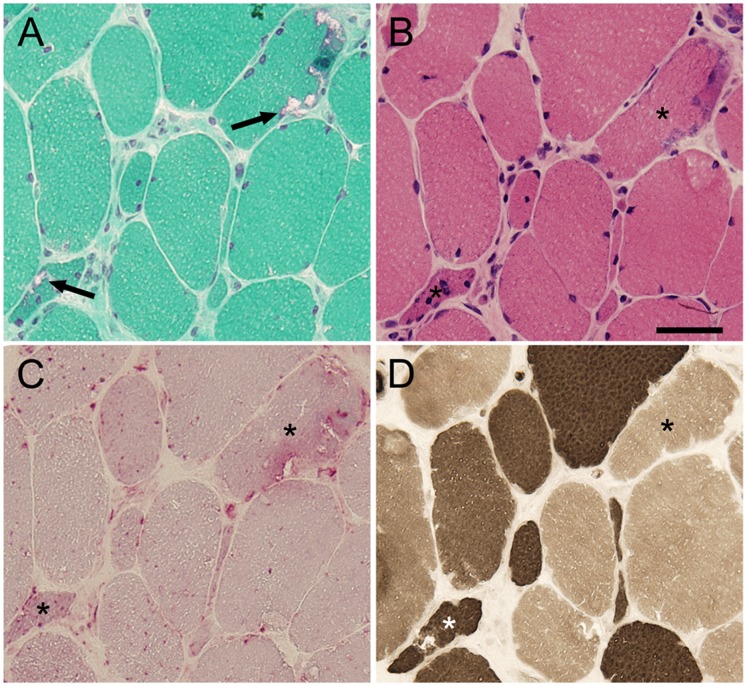
Figure 1. Pathological Characteristics of BMD patients. A:
On mGT staining, RVs are seen in the periphery of myofibers (arrow). B: On H&E staining, there is marked variation in fiber size with scattered small atrophic fibers. C: High acid phosphatase activity is seen in the areas of RVs. D: On ATPase staining pre-incubated at pH 4.6, RVs are seen in both type 1 and type 2 fibers. Asterisks indicate myofibers with RVs. Scale bar: 25 µm.

