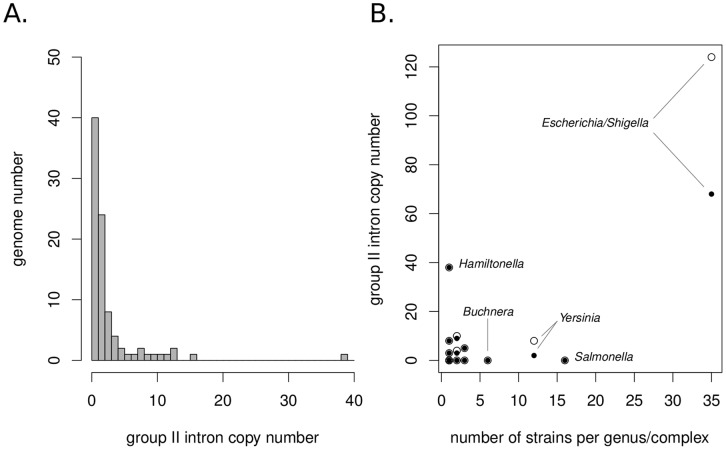
Figure 2. Distribution of (A) 90 Enterobacteriales genomes (corresponding to 18 genera/complexes) according to their group II intron abundance, and (B) group II intron abundance according to sequenced strain number within genera/complexes.
White dots: total number of detections considered; black dots: only distinct copies considered (see text). Names of genera/complexes with >20 intron copies and/or >5 sequenced strains are indicated.

