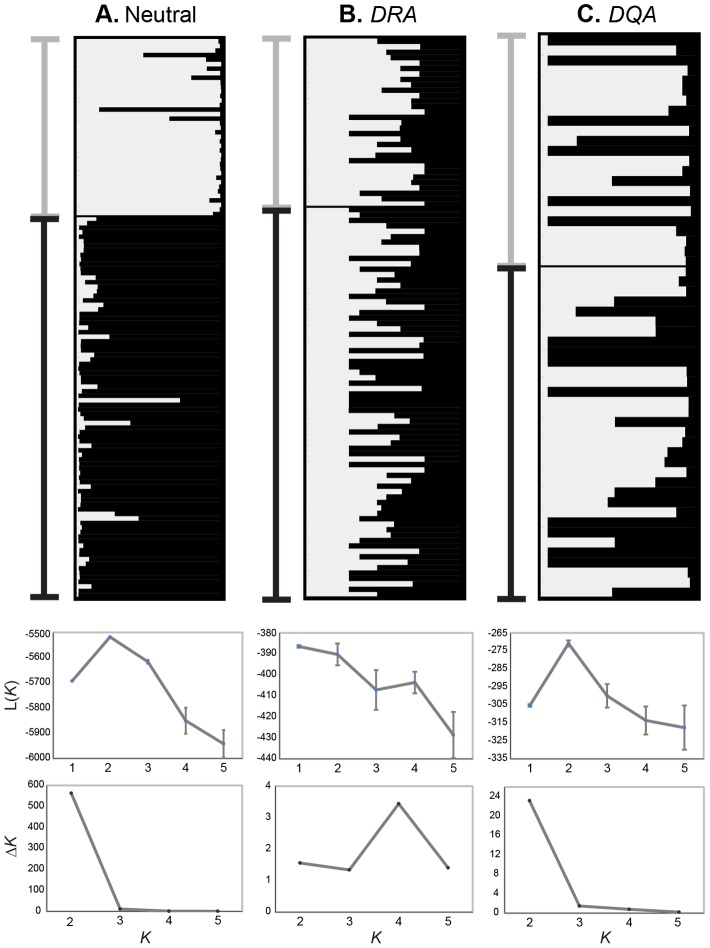
Figure 2. STRUCTURE plots of E. quagga from Etosha and Kruger.
Individual genetic clustering assignments under the model of K = 2 based on (A) neutral loci (13 microsatellites and the β-Fibr intron), (B) ELA-DRA, and (C) ELA-DQA. Percent assignment to each of two genetic clusters are shown for each individual genotype in plots. Population where an individual was sampled is indicated by the bar to the left of each plot (Etosha: black, Kruger: gray). The mean posterior probability (L(K)) ± 95% confidence interval and the rate of change in the log probability of the data between successive K values (ΔK) from K = 1 to 5, for each marker type are shown below each corresponding STRUCTURE plot.

