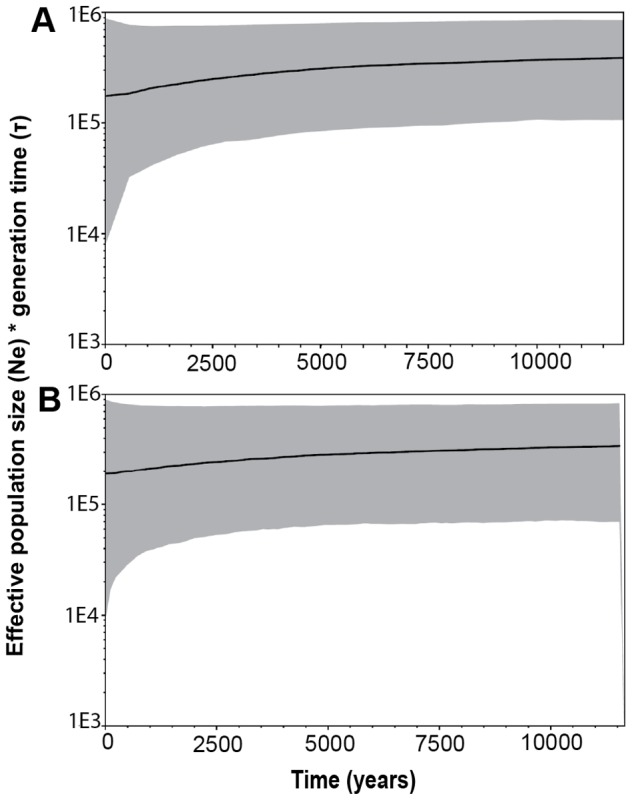
Figure 3. Bayesian skyline plots showing changes in population size over time.

Median estimates of effective population size (Ne), relative to generation time, is plotted over time (years before present) for (A) Etosha and (B) Kruger zebra populations. The 95% credibility interval is shown by gray shading.
