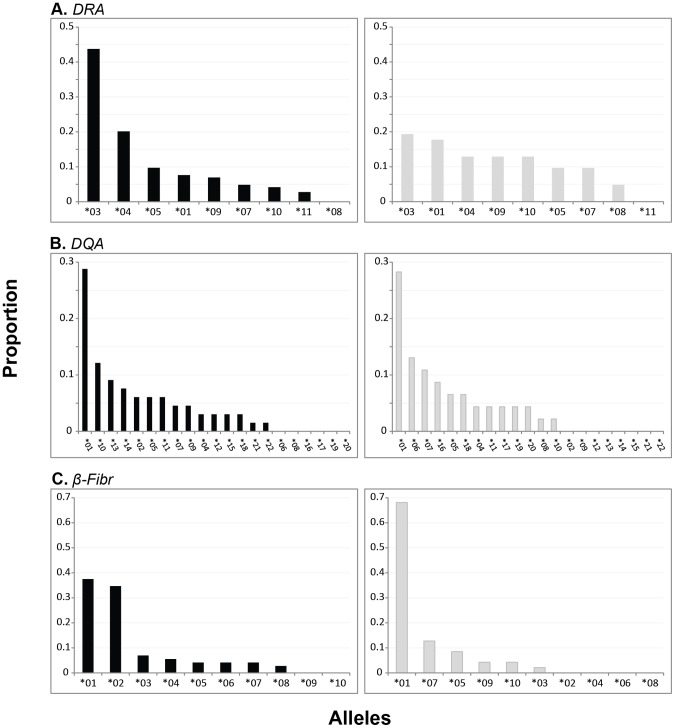
Figure 4. Allele frequency distributions by locus and population.
Alleles presented in order of descending frequency at the (A) ELA-DRA, (B) ELA-DQA, and (C) β-Fibr intron by population, with Etosha shown in black and Kruger in gray. Allele sample sizes are as follows: Etosha (β-Fibr: 72, DRA: 144, DQA: 66) and Kruger (β-Fibr: 47, DRA: 62, DQA: 46). DQA allele frequencies were calculated excluding individuals with multi-locus genotypes.

