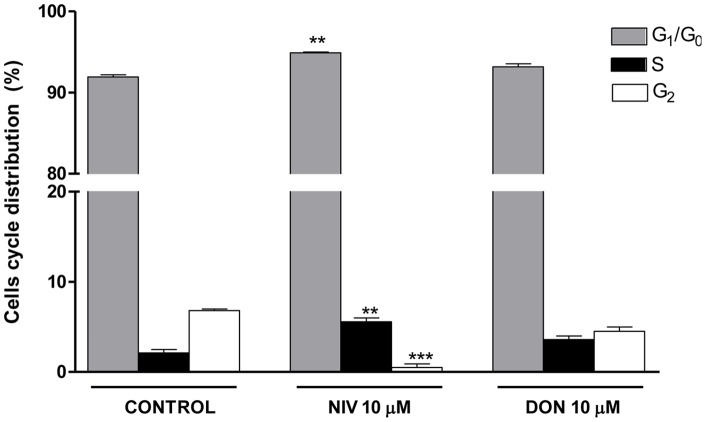
Figure 3. Flow cytometric analysis of IEC-6 cycle phase distribution.
Cells were treated with either NIV or DON (10 µM) for 24 h, incubated with PI and analysed for cell cycle analysis using a Becton Dickinson FACScan flow cytometer and ModFit software (***P<0.001,**P<0.01 vs control). Data are expressed mean ± s.e.m. from at least three-independent experiments.

