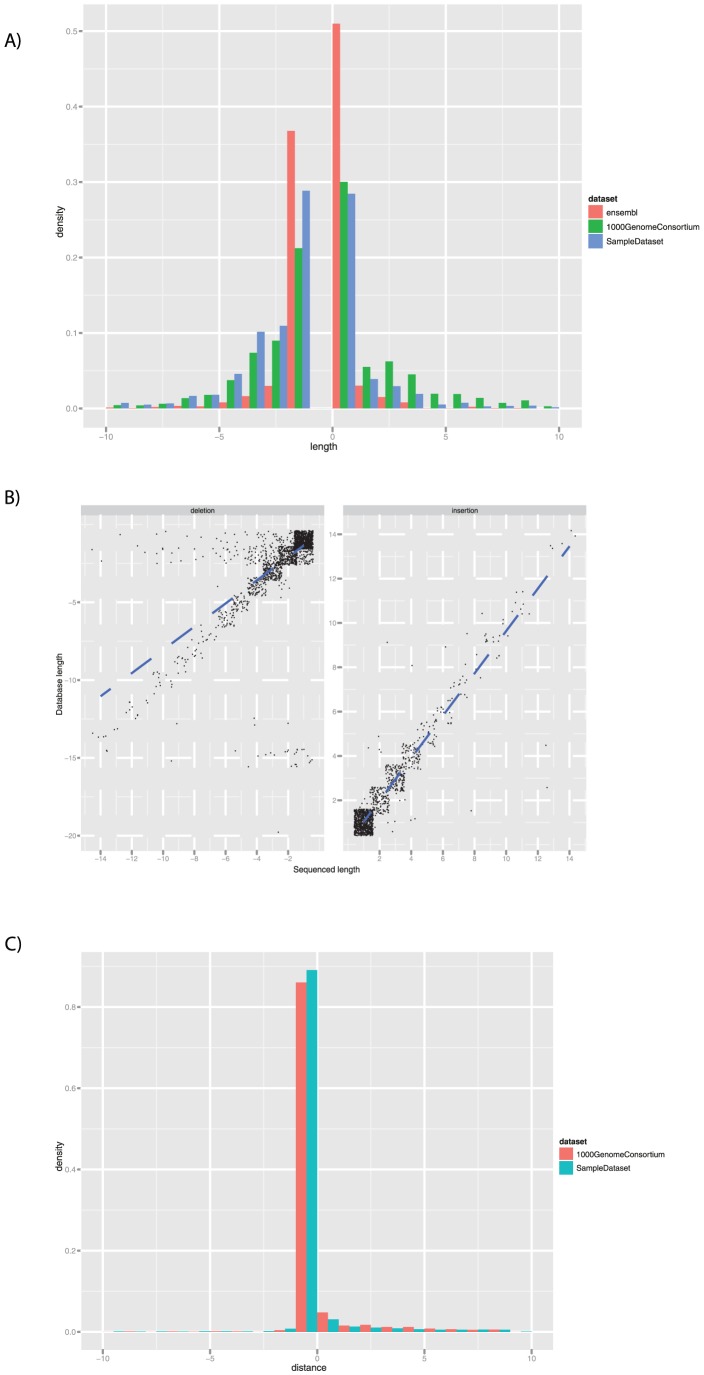
Figure 2. INDELs characteristics.
Figure 2A shows a comparison of the length of INDEL variants called in our patients, and those available in the same capture regions in the ENSEMBL database and in the 1000 Genome Consortium release. The plot shows a higher presence of 1 bp insertion/deletions in ENSEMBL, and an increased size detection capability in 1000 Genome data, obtained from whole genome sequencing. Figure 2B shows a correlation of the INDELs already described in ENSEMBL between the size of the variant sequenced in our samples and the length reported in the database (r2 = 0.9221 for insertions and 0.4213 for deletions, both with p value<2* 10−16). Figure 2C shows the distribution of the distance (i.e. difference between start positions) between the INDELs as they were called by Dindel on our data, or as released by 1000 Genome Consortium, and the corresponding ones present in ENSEMBL.

