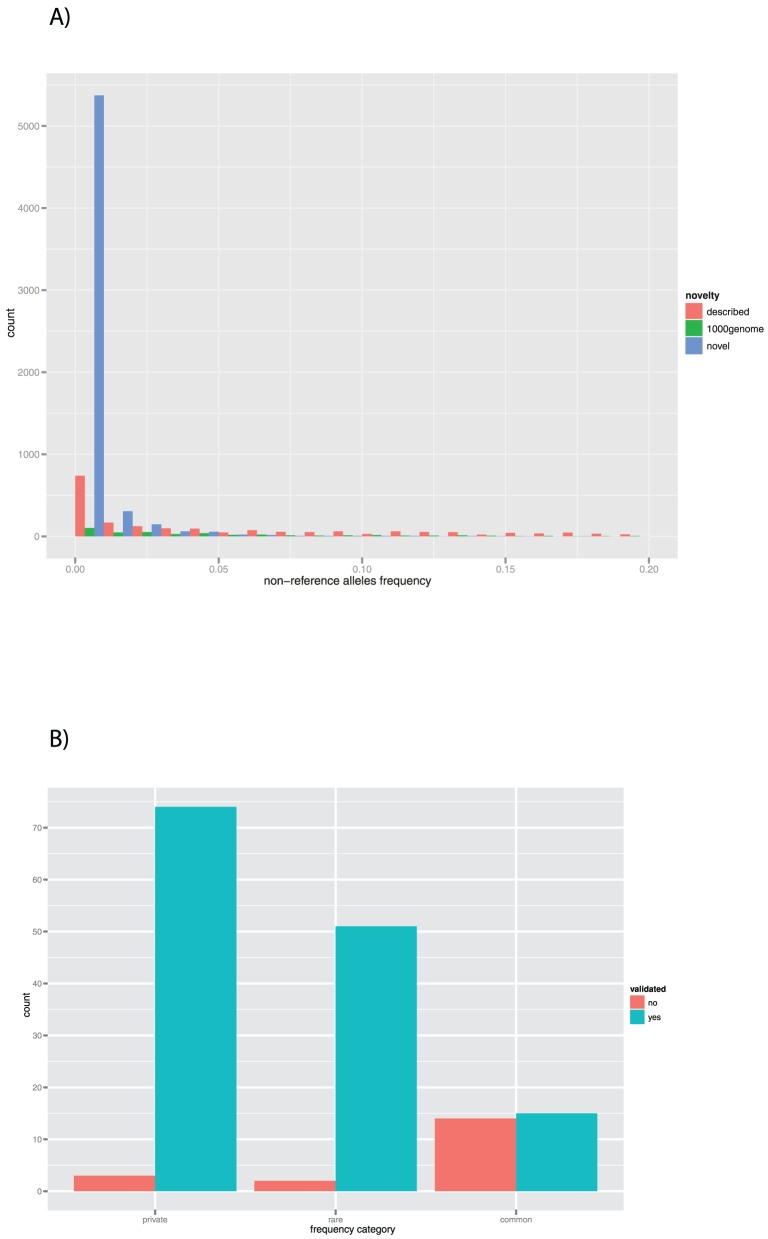
Figure 3. INDELs frequency and validation.
Figure 3A plots the non-reference allele frequency of INDELs called in our samples, divided in three categories: those already described in ENSEMBL, those described only in the released of 1000 Genome and those completely novel to our dataset, most of which are rare. Figure 3B shows the counts of validated INDELs according to the following frequency categories: common (non reference allele frequency equal or higher than 0.05), rare (frequency lower than 0.05) and private. The validation rate is significantly different in the three groups (Chi-squared = 44.4844, p-value = 2.189*10−10).

