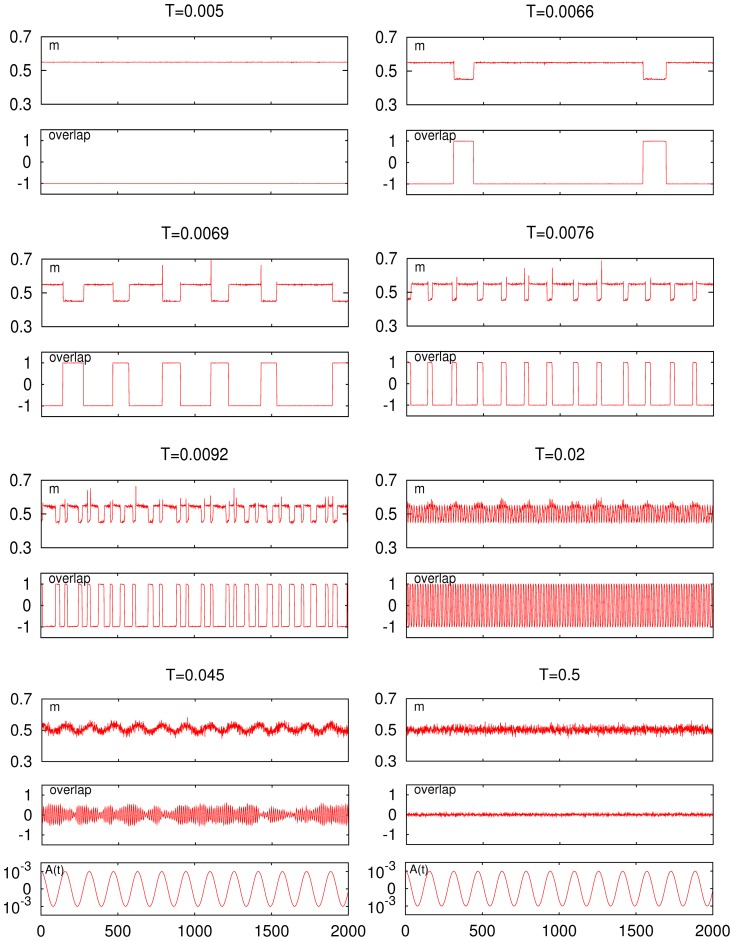
Figure 5. Time series for the firing rate (top graph of each set) and for the overlap (bottom graph of each set) at different temperature, as indicated, in the asymmetric case .
 . (Other parameters as in Fig. 4.) The second set from top in the right column corresponds to the low-
 peak; the bottom set in the left column corresponds to the high-
 peak. The common external signal
  and time scale are shown at the bottom below the sets.

