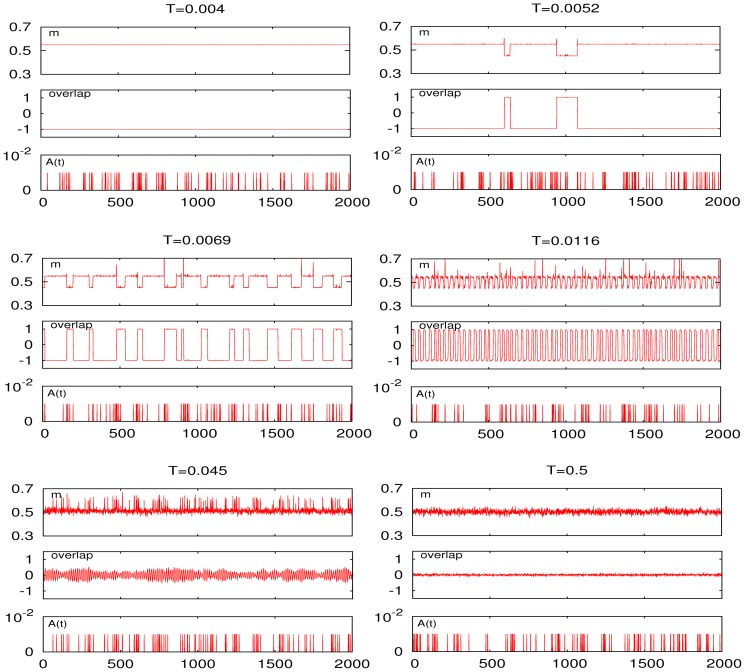
Figure 9. Time series for different values of .
 as indicated, corresponding to the SMR curve in
Fig. 8
for the Poissonian input train (shown below each set with the time scale). The resonances occur in this case around
  (second set in the left collumn) and
  (third set in the left column).

