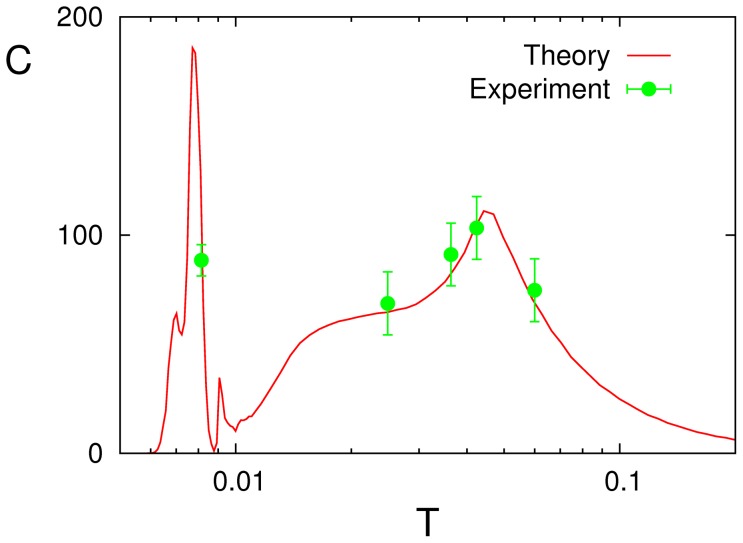
Figure 12. The experimental data (symbols with the corresponding error bars) reported in [54] are plotted here against our theoretical prediction (red solid line) corresponding to the case .
 in
Fig. 4
. To obtain this fit, the experimental data
  with arbitrary units are multiplied by a factor 180, and the external noise amplitude
  (which is given in dB) needed to be transformed into our intrinsic noise parameter
  using the nonlinear relationship
  with
with 

 dB, and
  dB.
dB.

