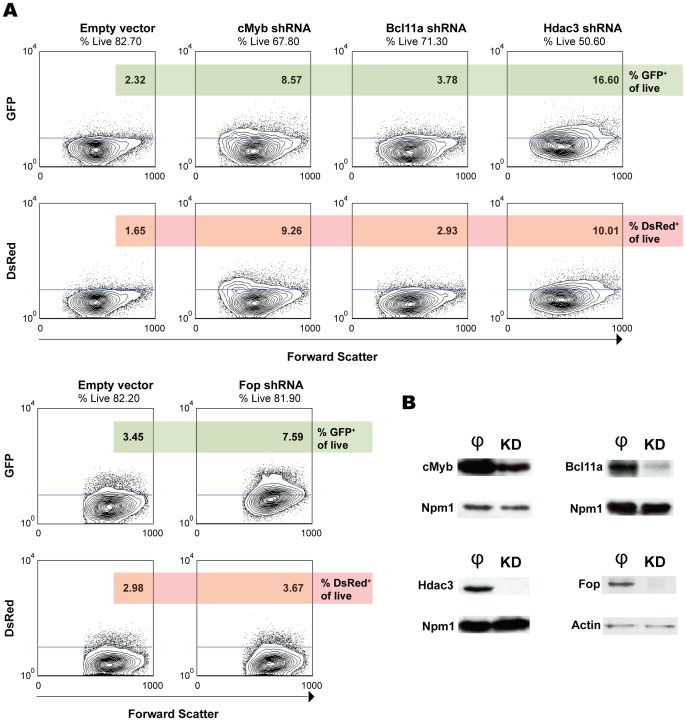
Figure 6. Knockdown assays in transgenic dual reporter fetal liver cell lines.
(A) Flow cytometry analysis of the knockdown of cMyb, Bcl11a, Hdac3 and Fop in the γGFP/βDsRed cell line. The same vector with a non-specific shRNA sequence was used as a control. Percentages of cells positive for GFP (upper panel) and DsRed (lower panel) are shown. Contour plots show gated live cells. (B) Western blots of the knockdown experiments in protein extracts of transduced cells. Equal numbers of cells are loaded on each lane. φ, empty vector control extracts; KD, knockdown extracts.

