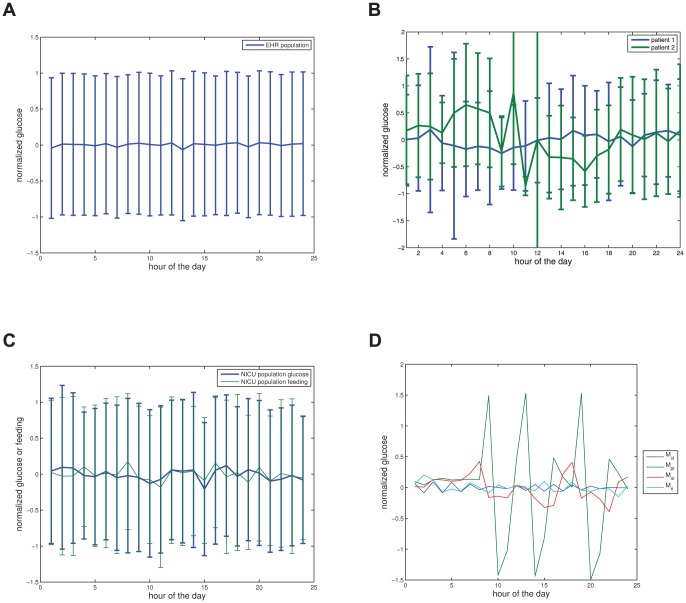
Figure 2. Depicted above are (a) the mean and standard deviation in glucose, by hour, for  patients whom have been normalized to mean zero and variance one, with at least two glucose measurements from the CUMC EHR; (b) the two individual patients mean and standard deviation in glucose measurements by hour, note the variability in patient
  for which there are far fewer measurements than for patient
  ; (c) the mean and standard deviation in glucose and enteral (i.e., tube) feeding rates, by hour, for
  normalized patients in the neural ICU; (d) glucose, by hour, for various different model feeding patterns.
(a) Normalized population glucose by hour. (b) Single patient normalized glucose by hour. (c) Normalized NICU population glucose and feeding by hour. (d) Normalized model glucose by hour.

