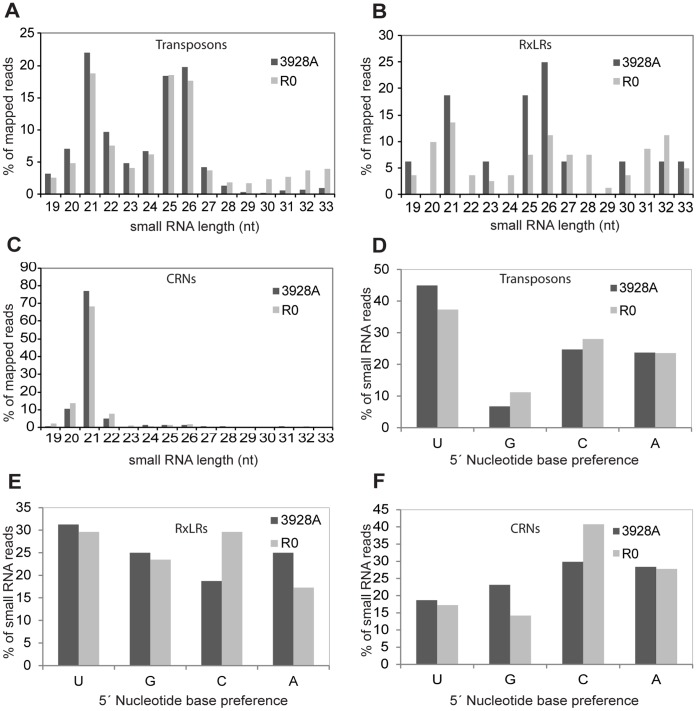
Figure 1. Size distribution and 5′ nucleotide preferences of sRNAs mapped to transposons, RxLR and CRN effector gene subsets in P. infestans isolates R0 and 3928A.
Abundance of each size class of sRNAs based on nucleotide (nt) length in: A. Transposons B. RxLRs and C. CRNs. The relative frequency of each 5′ terminal nucleotide of sRNAs aligned to: D. Transposons E. RxLRs and F. CRNs.

