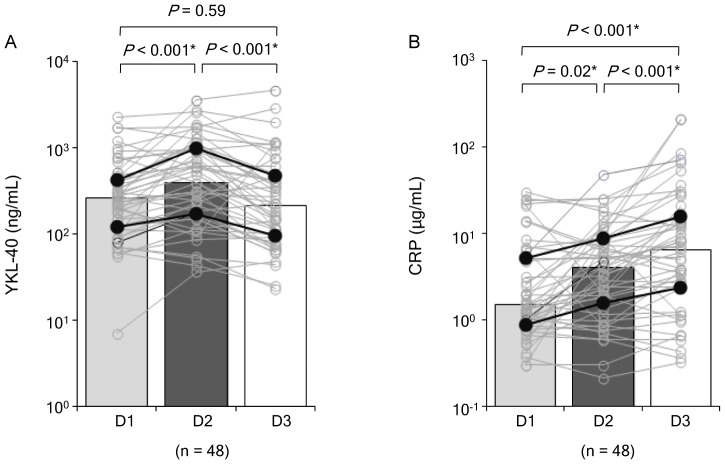
Figure 3. Temporal changes in YKL-40 (A) and CRP (B) levels following acute ischemic stroke.
Open markers indicate serially analyzed protein levels in each patient. Each box indicates the median, and the closed markers indicate the interquartile ranges. D1, within 12 hours of symptom onset; D2, 18–24 hours from baseline (D1); D3, 36–48 hours from baseline; CRP, C-reactive protein. *P<0.05.

