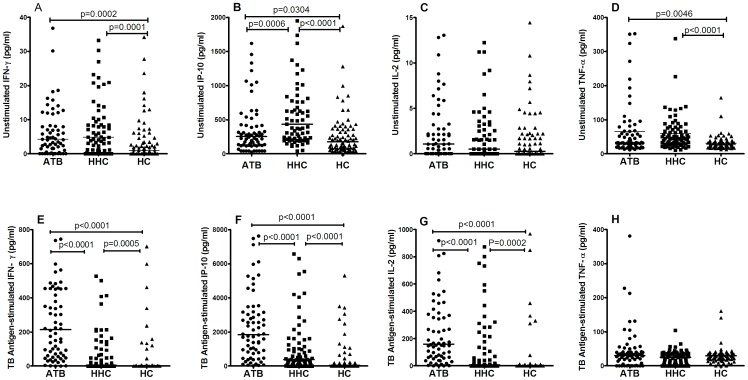
Figure 1. The un-stimulated and TB antigen-stimulated expression of IFN-γ, IP-10, IL-2 and TNF-α in patients with active tuberculosis (ATB group), household contacts (HHC group) and healthy controls (HC group).
The expression of IFN-γ (A and E), IP-10 (B and F), IL-2 (C and G) and TNF-α (D and H) were determined using ELISA and expressed in pg/ml. The horizontal line indicates the median amount of biomarker production.

